As the week comes to an end, let’s recap what happened in the markets, specifically the pairs that we follow.
Economic Calendar
While the beginning of the week was filled with market news and announcements, there is one important event to end the week and that is the Core PCE Price Index, due at 8.30 am EST Friday. Historically, that should only cause moderate to low volatility to the market. However, inflation and interest rates are some of the hottest trending topic in the markets lately and if there is a huge surprise in numbers, we can expect a shift in investors’ sentiment.
FOMC Recap
The Fed raised the interest rate by the forecasted 75 bps to 2.25%-2.5% range.
Let’s review what Fed Chair Powell said.
Powell rejected the notion that the U.S. economy is in, or soon to be in a recession as firms continue their hiring in excess of 350,000 additional workers each month (We can look at the past NFP numbers). This may help calm the recessionary fears that have swept the markets recently. However, he acknowledged that the economy might need to slow down a little more for them to contain inflation.
We can infer from the reactions on gold and USD pairs that the market received a more dovish signal from the Fed via the FOMC meeting, which caused the expectation for the next rate hike in September to lower down a notch, from 75bps hike to a half point hike.
Precious Metals
Gold

XAUUSD H4 Chart. Source: Tradingview
The Fed raised rates by the expected amount. While the greenback should get stronger against gold, the reality is the other way around given that there were no surprise from the Fed and market expectations have been priced in. Therefore, we observed a recovery of $46 on gold since the announcement. Besides, the Fed is seen to be more dovish than what the market expected previously, which caused USD to lose strength against other assets and currencies.
It is currently faced with 1770 resistance which corresponds to a 200 period moving average as it is trying to break through the trendline. Traders will need to pay attention to see if gold can break above this level. There will be short opportunities if price fails to break out. In an alternative scenario, 1785 might be an interesting area to look for shorts if this is going to be a fakeout.
The Fed raised rates by the expected amount.
| Technical Levels | Price Zone |
| R2 | 1785 |
| R1 | 1770 |
| S1 | 1710 |
| S2 | 1680 |
Forex
EURUSD
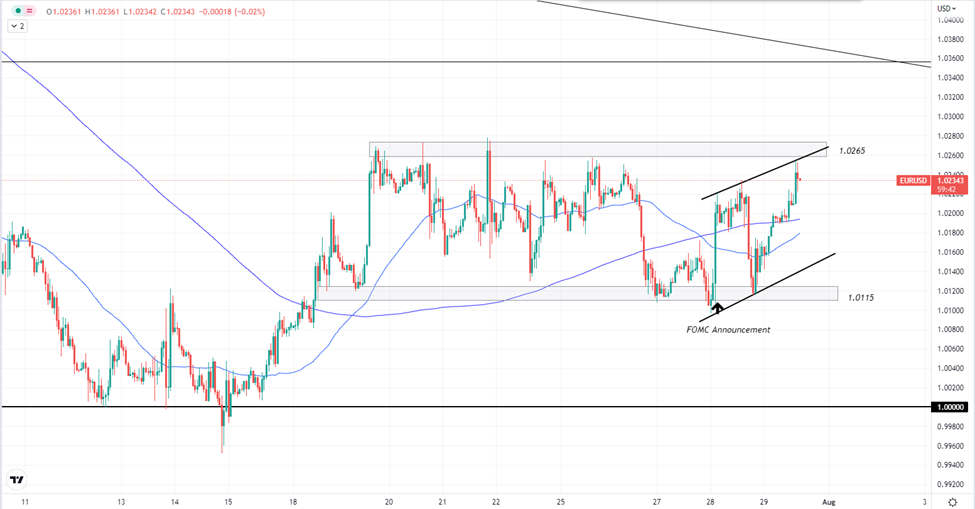
EURUSD H1 Chart. Source: Tradingview
The greenback got relatively weaker after the interest rate decision. EURUSD jumped from the lower boundary of the consolidation following the news and is now approaching the upper boundary of the range. The pair has also created a bullish market structure along the way with higher highs and higher lows, forming a bullish channel.
A breakout to the upside is possible, but again we have to take USD’s strength into consideration with the Fed expected to raise rates in the following meetings.
| Technical Levels | Price Zone |
| R2 | 1.0360 |
| R1 | 1.0265 |
| S1 | 1.0115 |
| S2 | 1.0000 |
Energies
WTI Crude
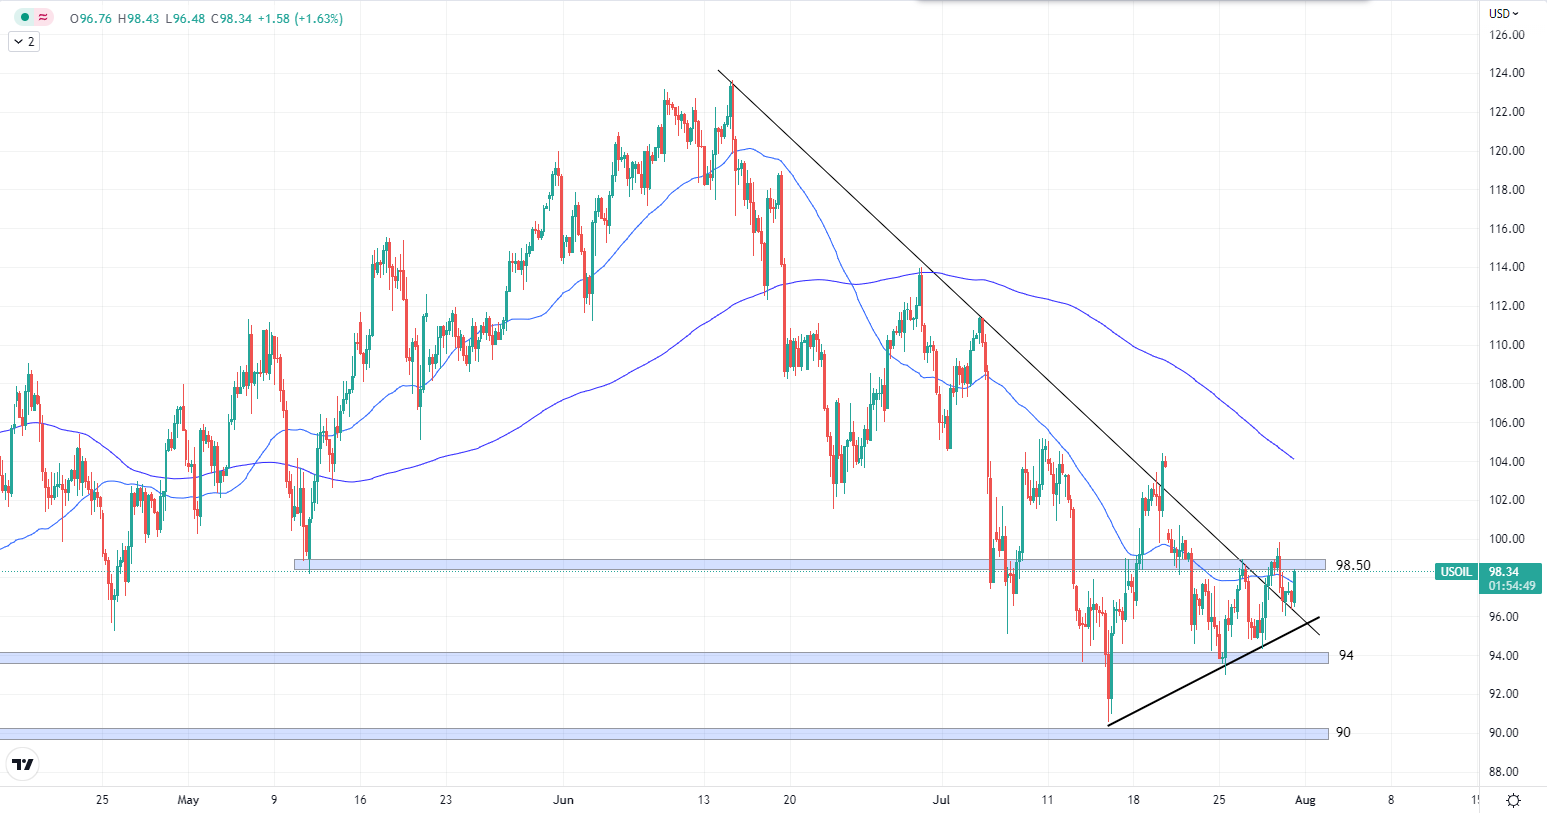
USOIL H4 Chart. Source: Tradingview
Following the FOMC meeting and Powell’s statement, the sentiments are starting to shift from being plagued by recessionary fears to an undersupply in the oil markets.
A key event to keep an eye out for is the OPEC+ meeting that will take place on 3rd of August, 2022. U.S. President Joe Biden also visited Saudi Arabia to have talks on oil production 2 weeks ago on July 15th, which could have increased the chance of an increase in oil output.
From a technical standpoint, oil price steadies and made higher lows. It is now sitting above the broken trendline and is testing $98.50 resistance. A breakout to the upside and back to triple digits is likely based on the factors we discussed.
| Technical Levels | Price Zone |
| R2 | 104.00 |
| R1 | 98.50 |
| S1 | 94.00 |
| S2 | 90.00 |
US Stocks Market
SP500
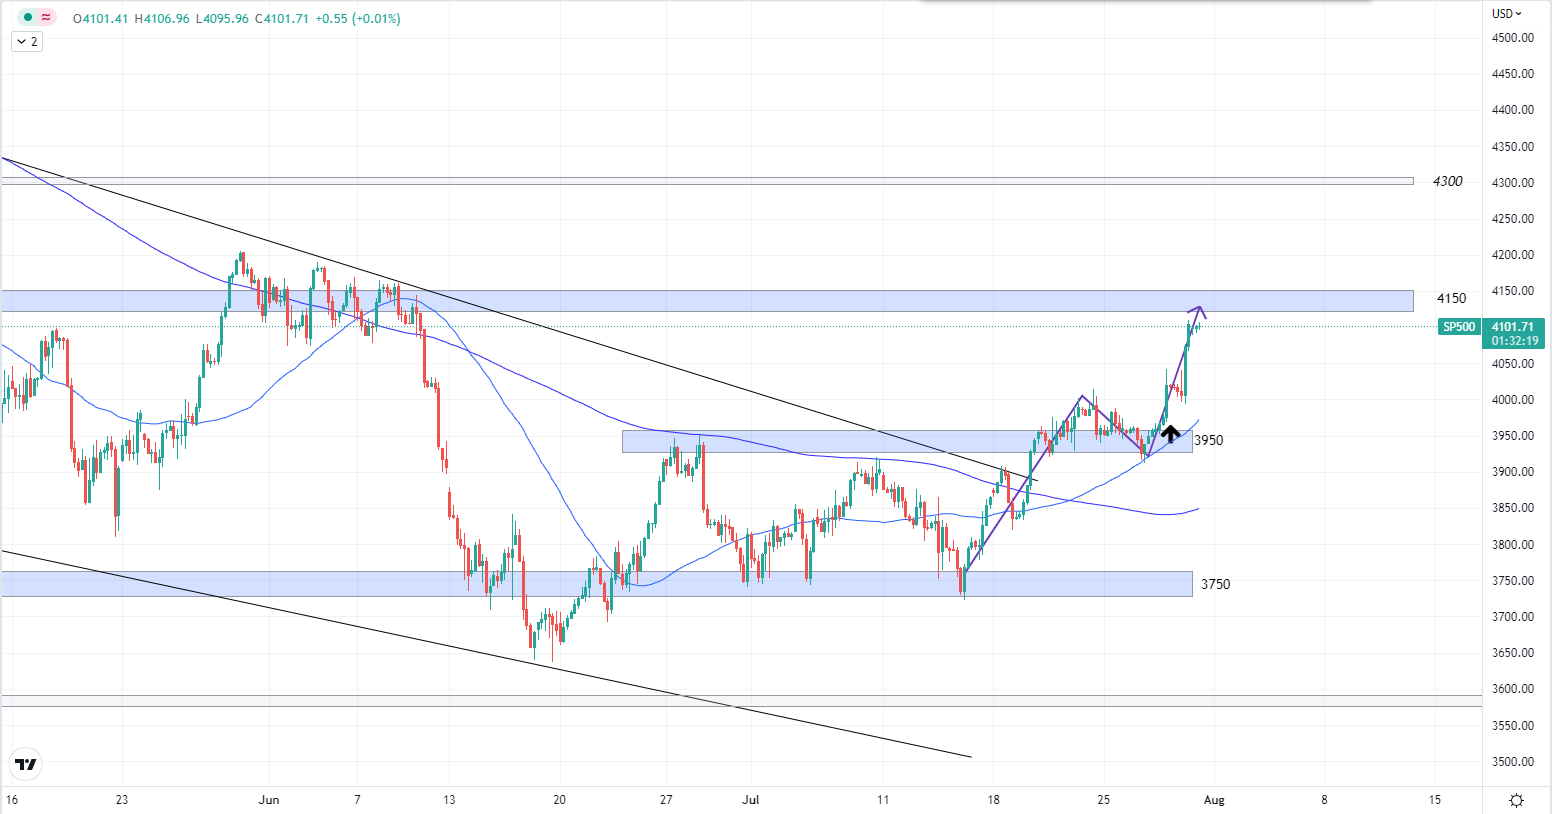
SP500 H4 Chart. Source: Tradingview
The US stock market in general reacted favourably to the interest rates announcement. We are seeing some slow and steady recovery for SP500 after a prolonged period of down trend. Marked on the chart with an arrow is when the news was released and we observed a jump in prices.
In terms of technical analysis, SP500 broke out from its bearish channel and did a textbook retest on a broken resistance-turned-support at 3950. Now, it is heading towards 4150 resistance and we shall see if it is able to break through. If it does, 4300 will be our next target. Also, the 50 MA crossed over the 200 MA, which served as a bullish confluence for SP500.
| Technical Levels | Price Zone |
| R2 | 4300 |
| R1 | 4150 |
| S1 | 3950 |
| S2 | 3750 |
Cryptocurrencies
Bitcoin

BTCUSD H4 Chart. Source: Tradingview
The largest cryptocurrency also benefited from the FOMC news where it jumped by more than 13% following the event. Currently testing its previous swing high of $24320, it is poised for a breakout and continue to test a higher resistance at $25418.
Is the hope coming back for the Bitcoin hodlers?
| Technical Levels | Price Zone |
| R2 | 25418 |
| R1 | 24320 |
| S1 | 20750 |
| S2 | 19000 |
Welf
Technical Analyst
________________________________________________________________________________________________________________
Want to trade more than 300+ instruments with raw spreads starting from 0 pip and commissions as low as $2 per lot per side?
Sign up with FXPIG now!


