Economic Calendar
Long weekend in the US, Europe, and most of Asia. Thinner volumes and increased volatility in the markets so be sure to trade safely.
XAUUSD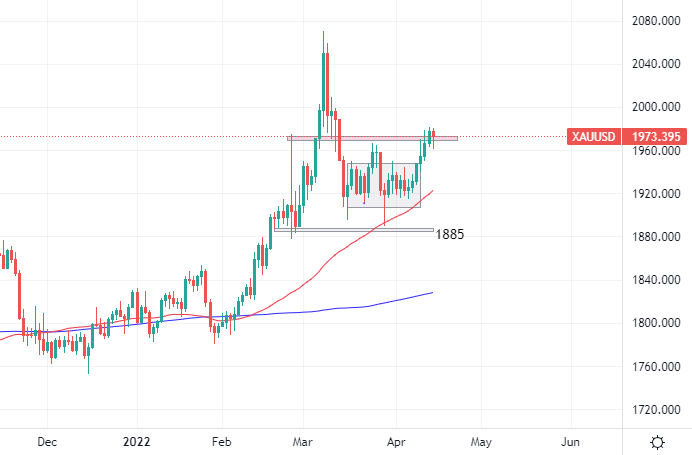
After a six days gaining streak, the yellow metal is trading above its resistance in the 1970 area. Gold is a mixed bag right now as on one hand there is Fed's continuous rate hike weighing on gold prices, and on the other hand, we have geopolitical tensions supporting gold’s demand. There is no trading today as Banks are closed, and we are expecting higher volatility with thinner volumes next Monday (still a Bank Holiday for most major economies)
If gold can break through 1970 successfully, we are looking at $2000 psychological level, while the downside is supported by the 50-day moving average.
Crude Oil
USOIL H4
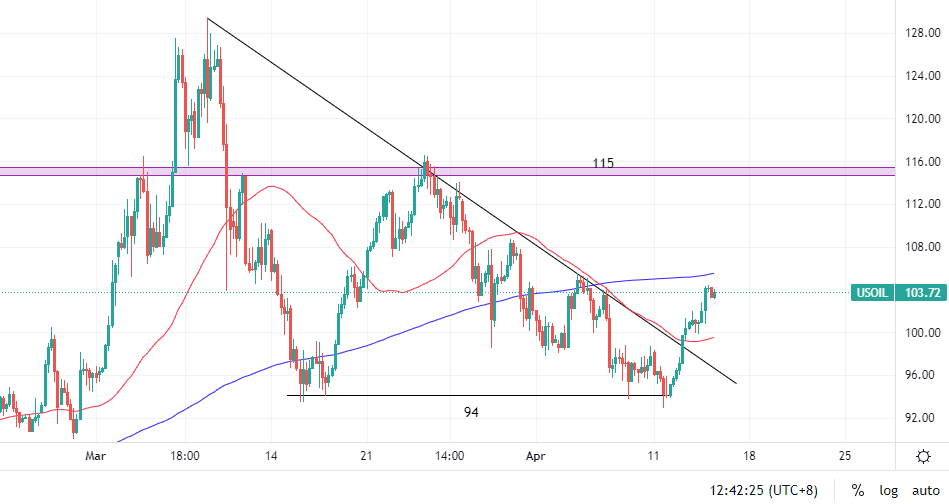
US Crude is trading at triple digits again after breaking through its bearish trendline.
There is a potential trade idea here when the 50 MA crosses above the 200MA. Swift recovery for China’s covid cases is one of the bullish fundamental confluences that we are waiting for.
The downside is supported by 50MA at the moment, while 200MA is the minor resistance and $115 is the next key resistance.
USDJPY
USDJPY H4
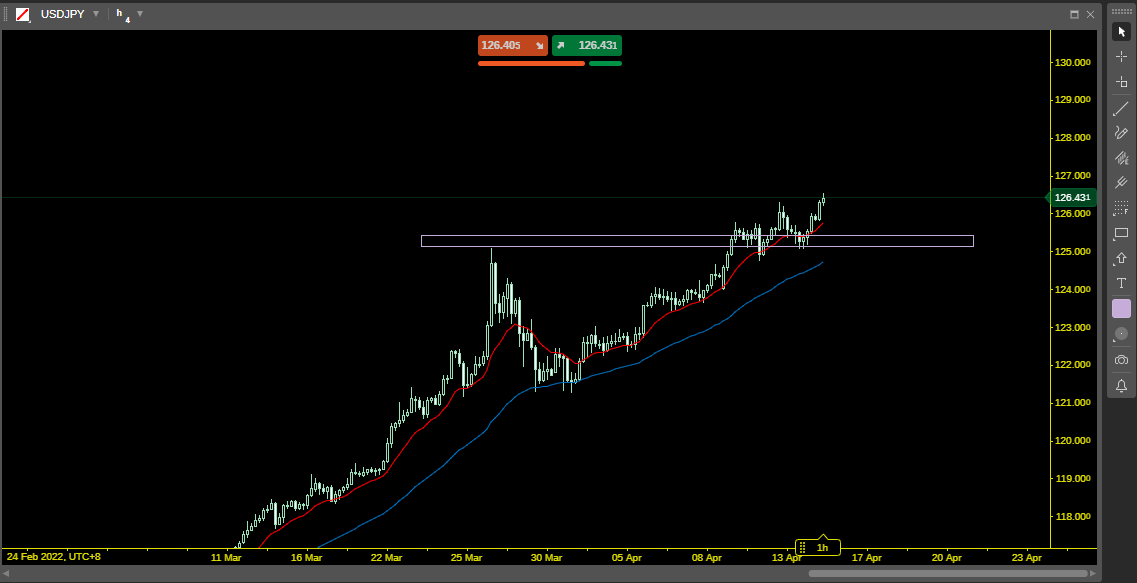
Dollar yen continues to advance after hitting a 20-year high earlier this week and it has already gained 60 pips since the market opened today.
The chart above is taken from FXPIG’s cTrader platform and if you notice there are red and green bars below the one-click trading button.
The bar represents the clients’ sentiment. The relatively huge red bar indicates that an overwhelming majority of retail traders are actually shorting the pair right now. It is a great contrarian tool to use as retail traders are wrong most of the time.
As short positions get liquidated when the price moves higher, the ratio (the bar) is going to reduce back to around 50.
Technical levels are 130 for the mid to long-term target, while the previous swing high at 125.70 will act as the next level of support.
SP500

SP500 Weekly
It was a losing week for the US stocks market with SP500 down 2.13%, Dow Jones down 0.72%, and Nasdaq down 2.94%.
.
USTEC
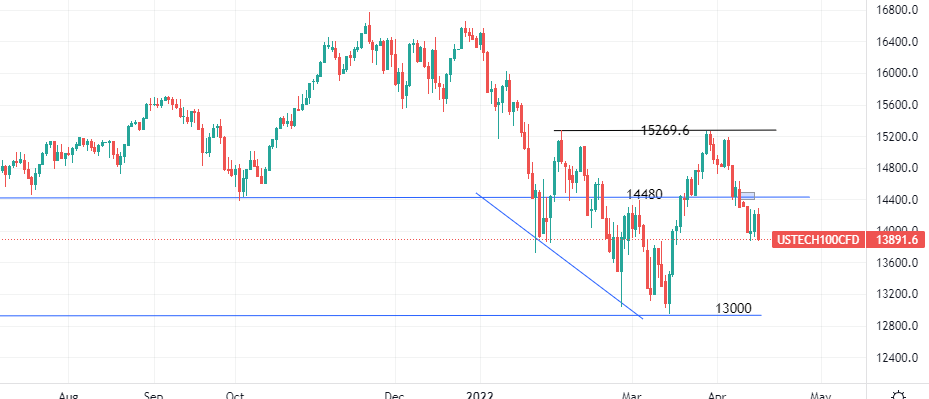
Nasdaq Daily
After making a double top formation, USTEC is reversing to the downside with 13000 as the next key support.
.
BTCUSD
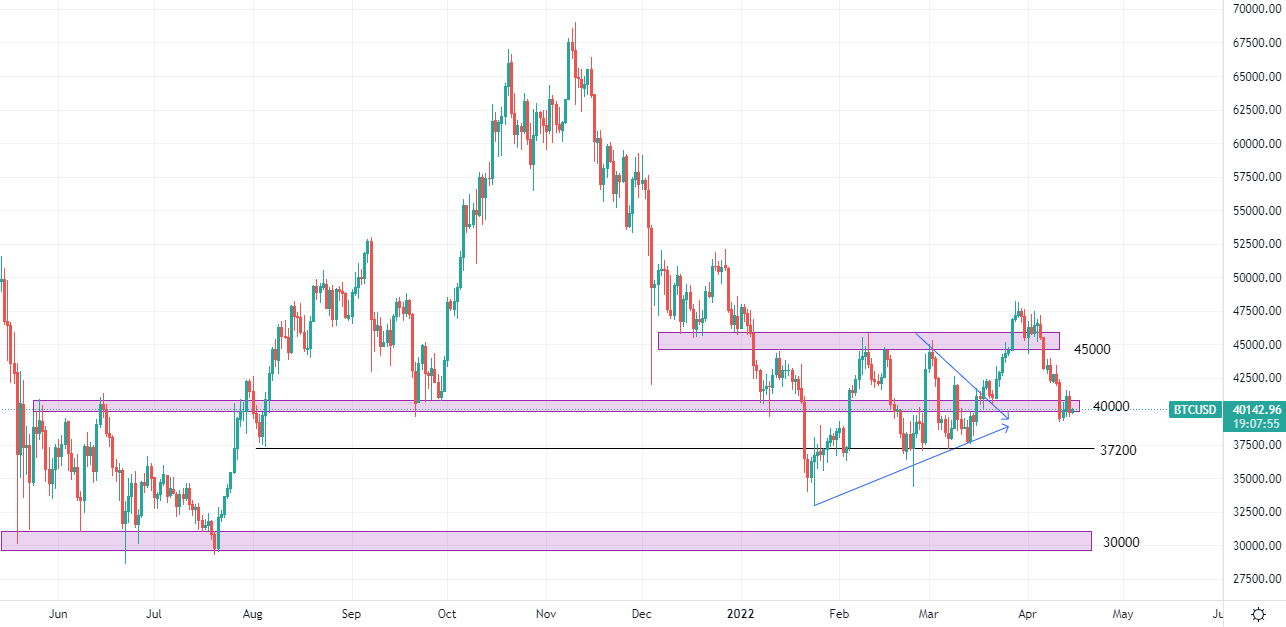
BTCUSD Daily
Bitcoin attempted a bullish run after breaking through its triangle formation. However, the bulls did not have enough fuel to hold on and the momentum died. It came back down and breached below the $40000 level briefly and is now trading just above that level. Back to the junction, we are still looking for any directional guide for Bitcoin.
Welf
Trader, Technical Analyst


