
Economic Calendar
Monday- UK Monetary Policy Report Hearing
Wednesday- Fed Chair Powell speaks, UK CPI, Canadian CPI
Saturday- Australia election
EURUSD
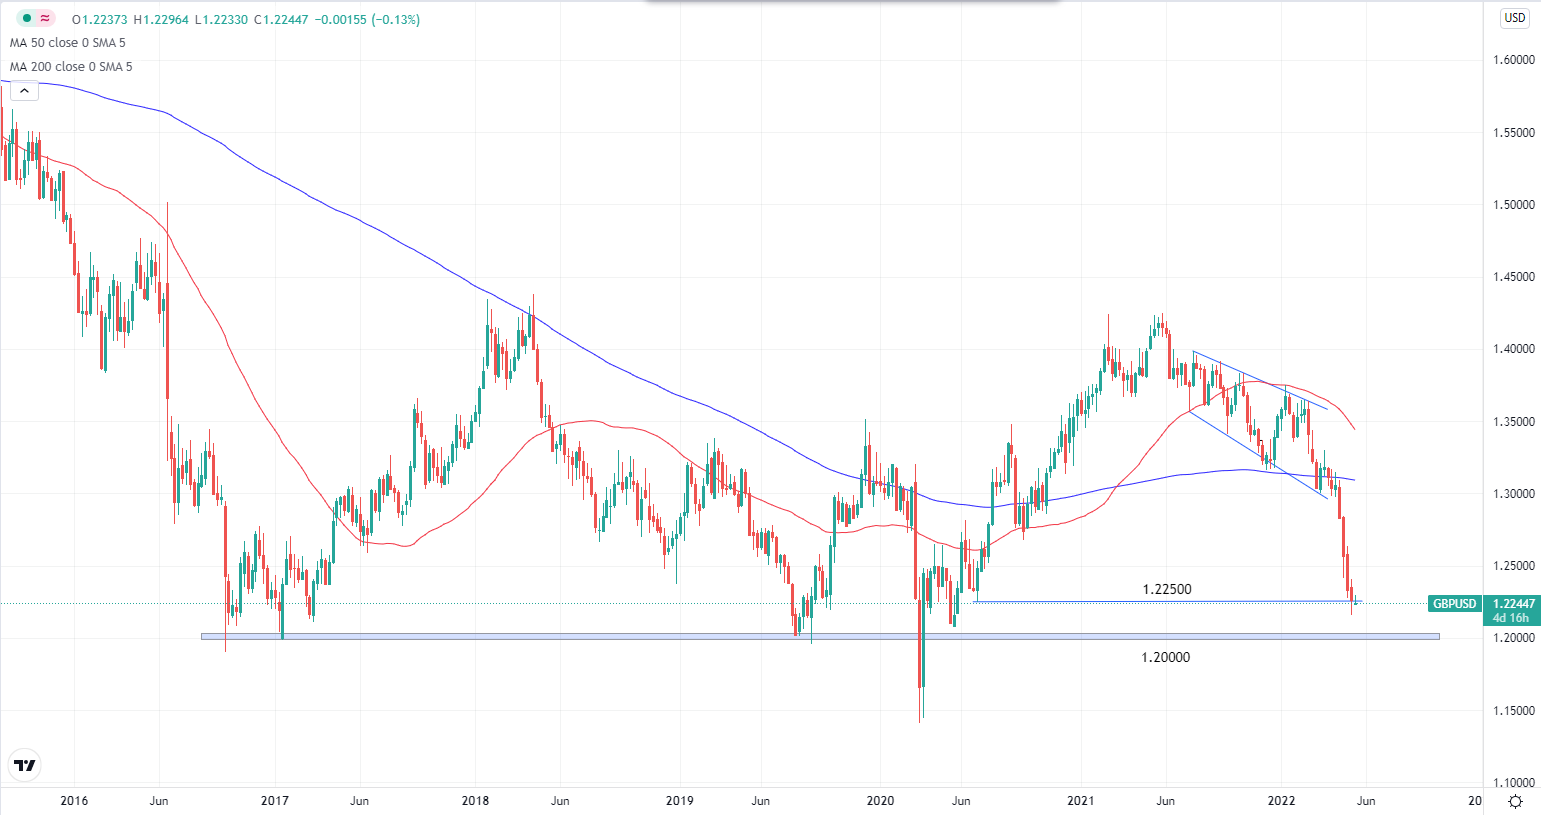
EURUSD Weekly Chart. Source: TradingView
If we take a step back and look at the weekly chart on EURUSD, we can see that parity is not so far away. It is currently just sitting on 1.0350 support and if it breaks, there is not much support for the Euro. If Euro continues to depreciate against the dollar at the same rate during the past 3 months, we can expect the pair to reach parity in 2 to 3 weeks' time
Metals
XAUUSD
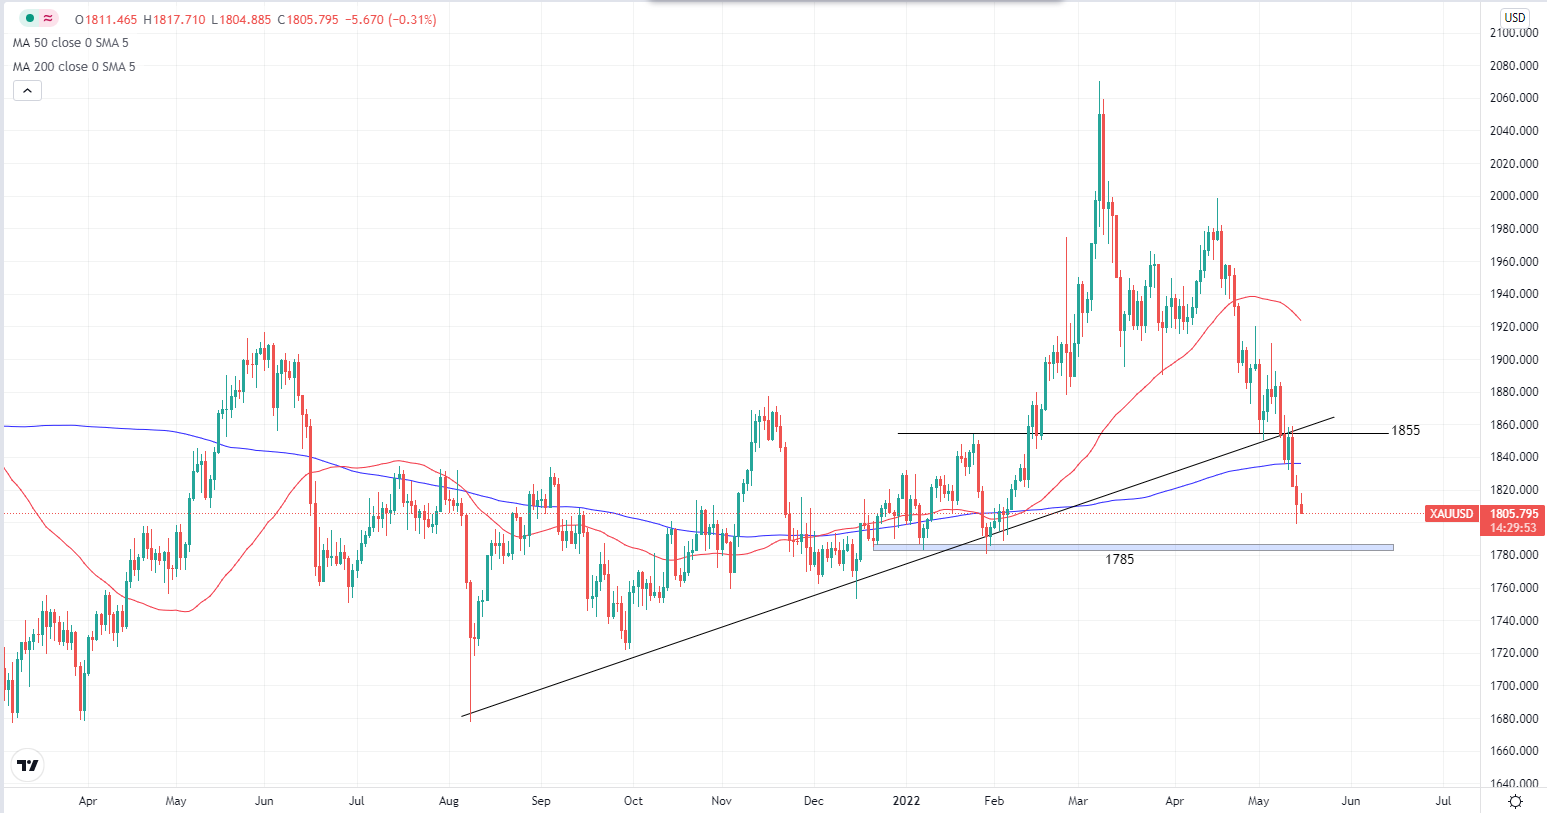
XAUUSD Daily Chart. Source: TradingView
Gold has broken below the 1800 key level and it is approaching 1785 at an aggressive pace. 1785 might be the last major support before it enters a free fall area, until 1680 at the lower end of the range. The fall in gold price may be primarily due to rising interest rates, and the increased opportunity cost to hold gold instead of other higher-yielding assets.
Energies
Crude Oil
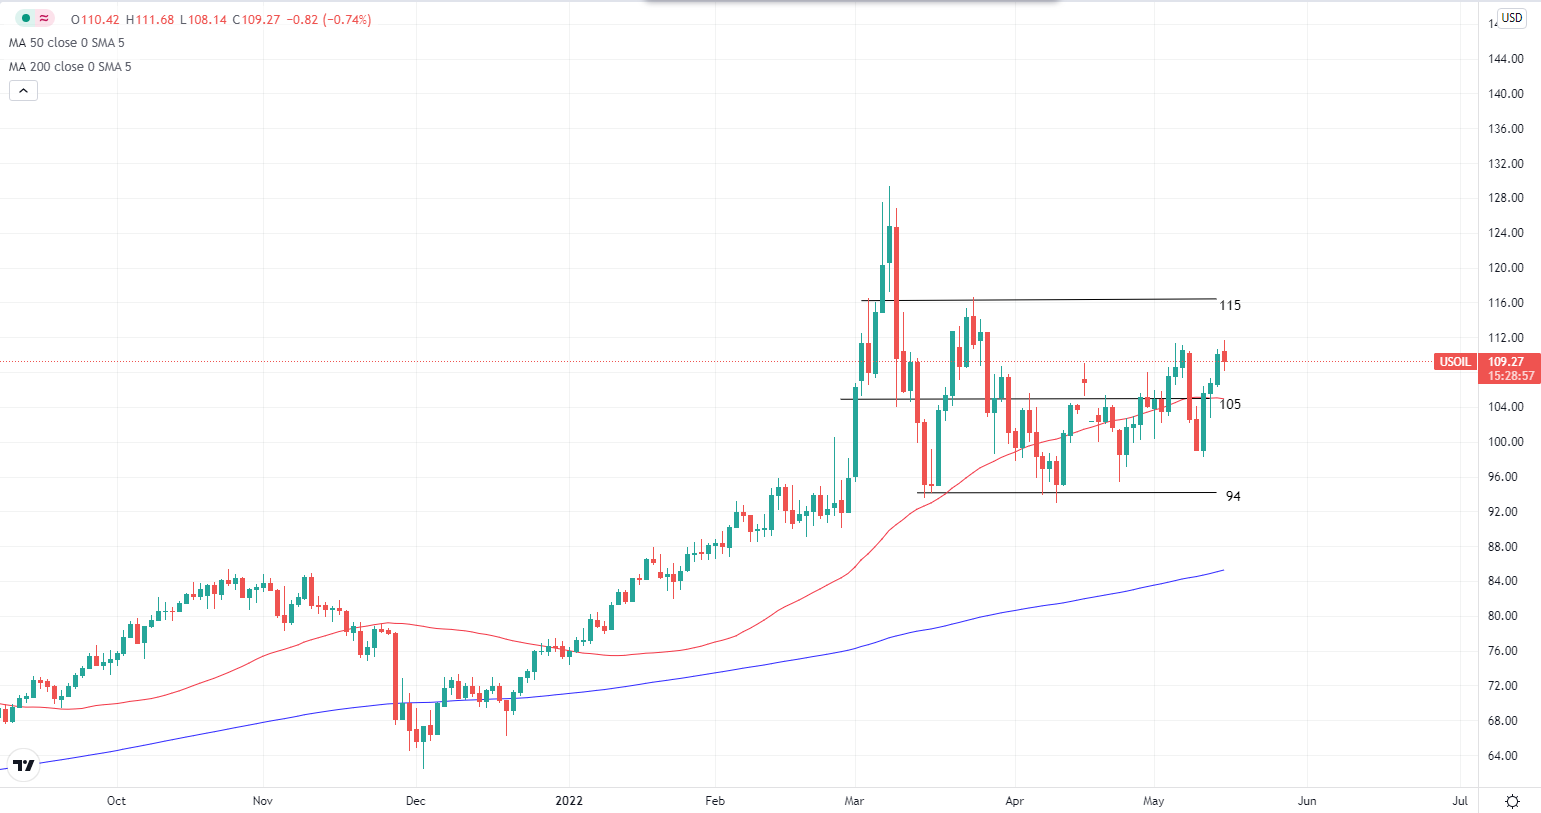
Crude Oil Daily Chart. Source: TradingView
Crude oil continued to rise and ended the previous week at almost breakeven. Trading above the $105 pivot and 50 daily moving average acting as dynamic support, it is more likely for Crude oil to rise more, with the next immediate target at $115.
Cryptocurrency
BTCUSD
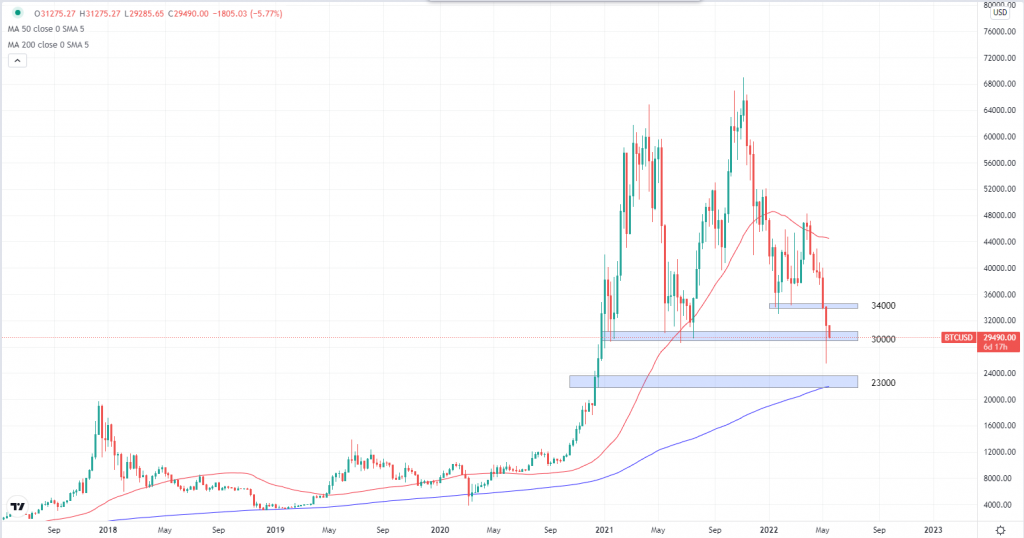
BTCUSD Weekly Chart. Source: TradingView
The largest cryptocurrency by market capitalization, Bitcoin, is starting the week in the red. It is currently down 5.7%, trading just below $30000. Capital is fleeing from risk assets like Bitcoin because of global uncertainties including inflationary concerns, China’s covid situation, and Ukraine Russia war just to name a few. Bitcoin is also following a similar path with a significant positive correlation to traditional stocks, losing its appeal as a means for portfolio diversification.
Stocks Markets
SP500

SP500 Daily Chart. Source: TradingView
There was a slight recovery during last Friday’s trading, but it couldn’t close past 4050 resistance. If there is a continuation to the downside, which is more likely the case considering the solid bearish momentum since April, we are looking at 3860 being broken and SP500 heading straight to 3750.
Welf
Trader, Technical Analyst
Don’t miss out on BIG market moves!
Sign up for an account at FXPIG now to trade more than 300 instruments, including 60+ Crypto CFDs, 24/7 with spreads as low as 1 cent!


