Economic Calendar
| Day | Event |
| Friday | NZD Bank Holiday |
Forex
EURUSD
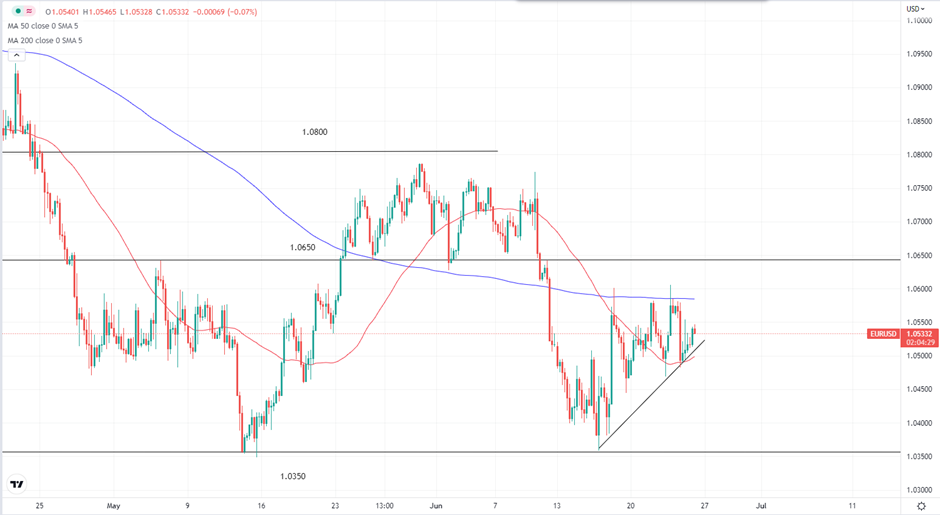
EURUSD H4 Chart
The fiber has been edging higher towards the 1.06000 key level, currently trading at 1.05 ish between the 50 and 200 moving average. Consecutive higher lows created a bullish trendline on the 4-hour chart and the pair may be more inclined to the bullish side in the short term, with the PMI coming out lower than expected (52.4 vs 56)
Precious Metal
XAUUSD
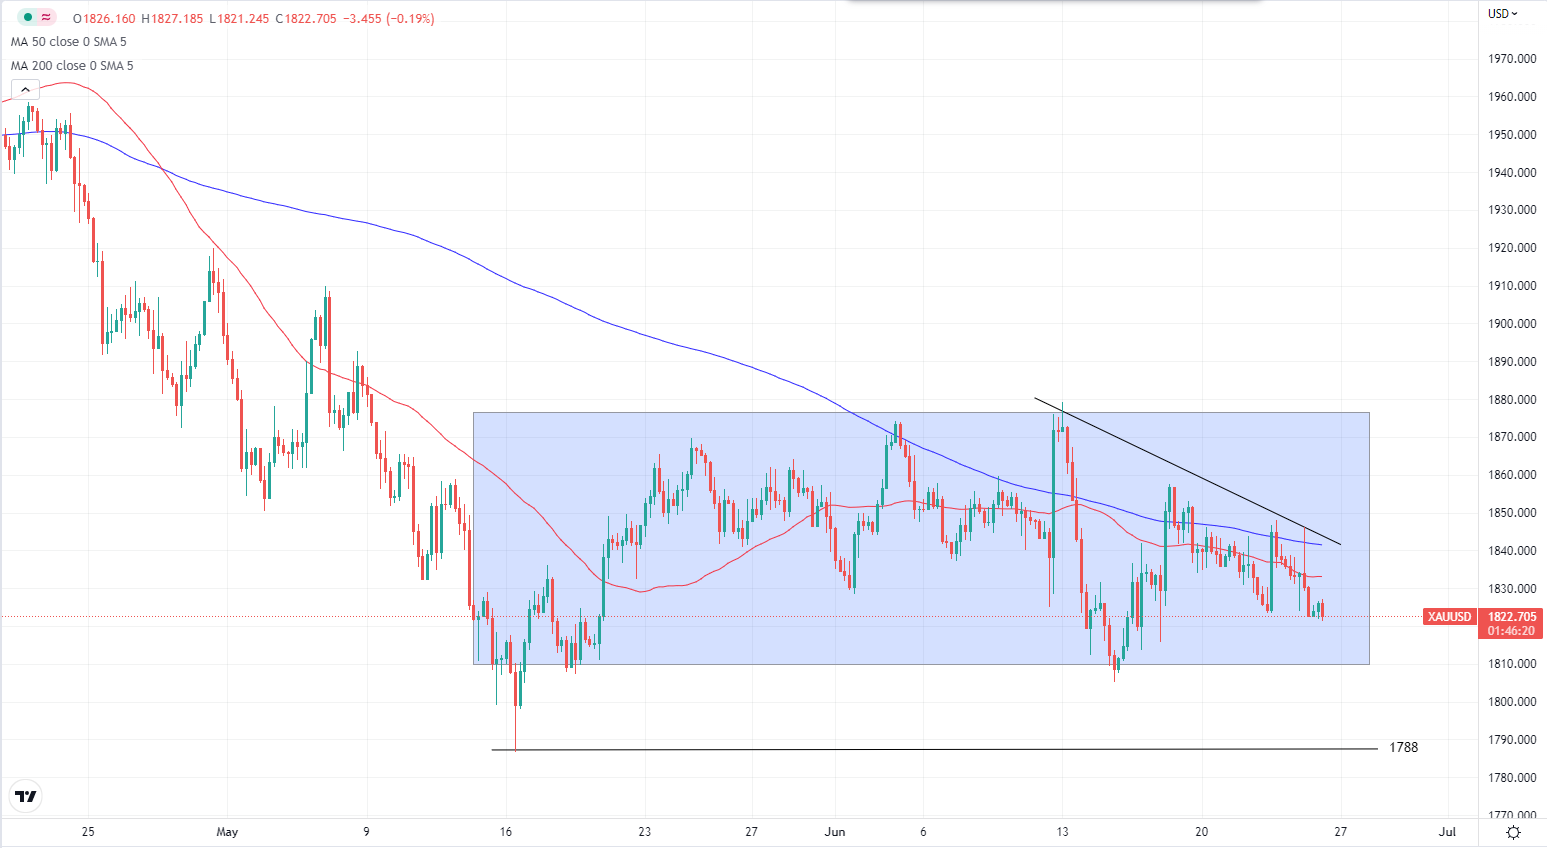
Gold H4 Chart
With lower highs being made and both moving averages applying downwards pressure, gold is positioned for a bearish break from its consolidation range. It traded as high as 1846 before the PMI figures were released. It plunged shortly after the announcement to a low of 1822.60. If it does break from its current range, the first target price level is 1788.
Energies
Crude Oil
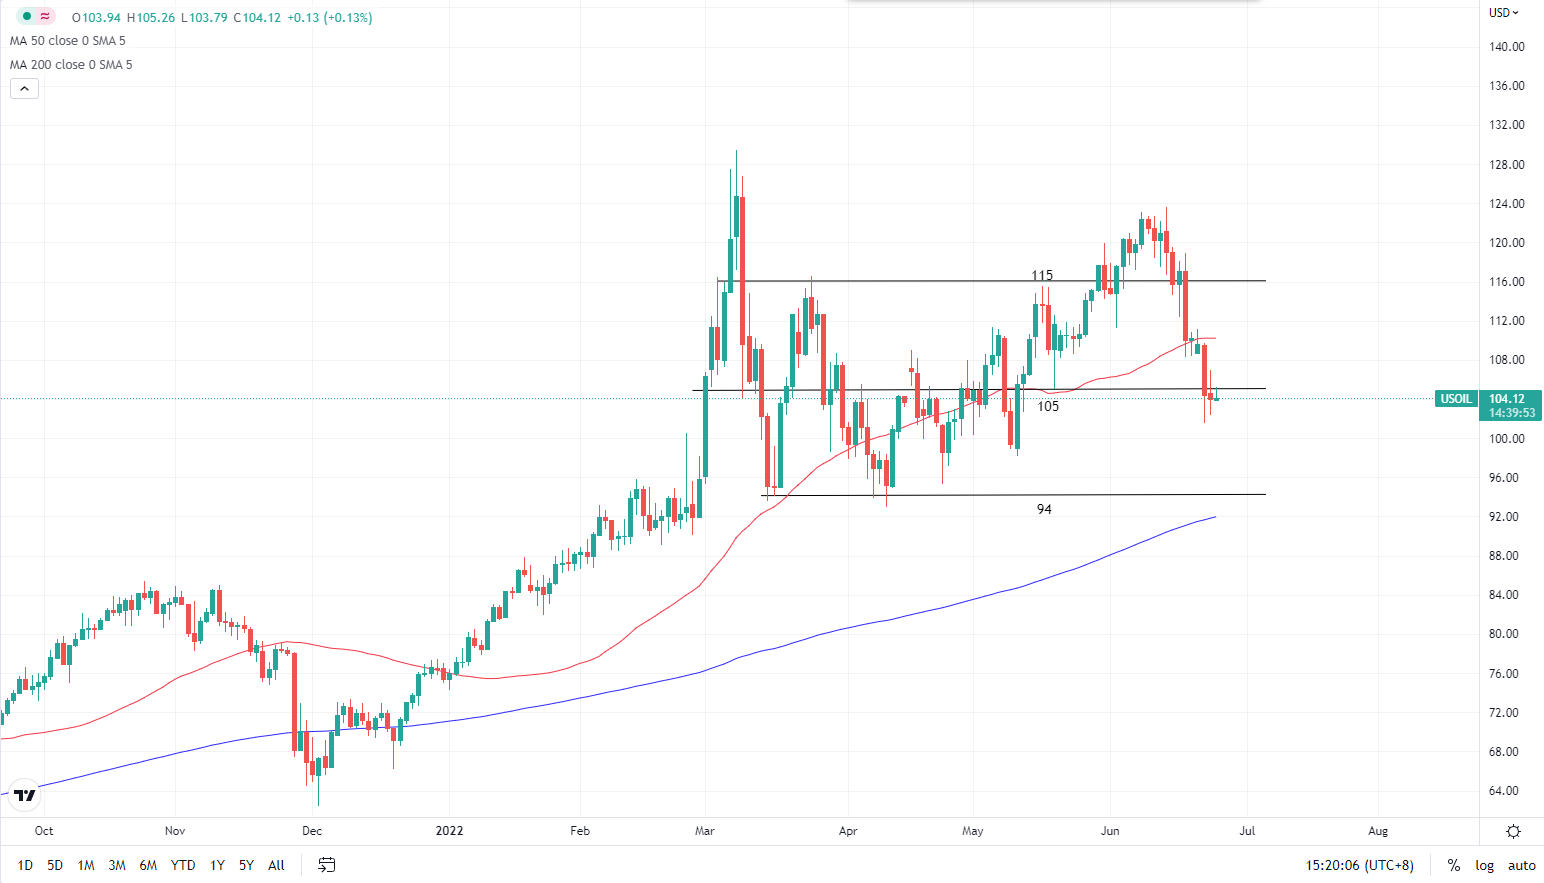
USOIL Daily Chart
Crude oil tumbled 5.35% this week. The aggressive rate hike by the Fed is triggering fears that the economy may slide into a recession and reducing the demand for crude oil which cause the sell-off in crude over the past 2 weeks. After an indecisive day yesterday (-0.4%), we shall see if crude will extend its sell-off to end the week lower. Underneath is the $94 key support coinciding with the 200 daily moving average.
US Stocks
SP500
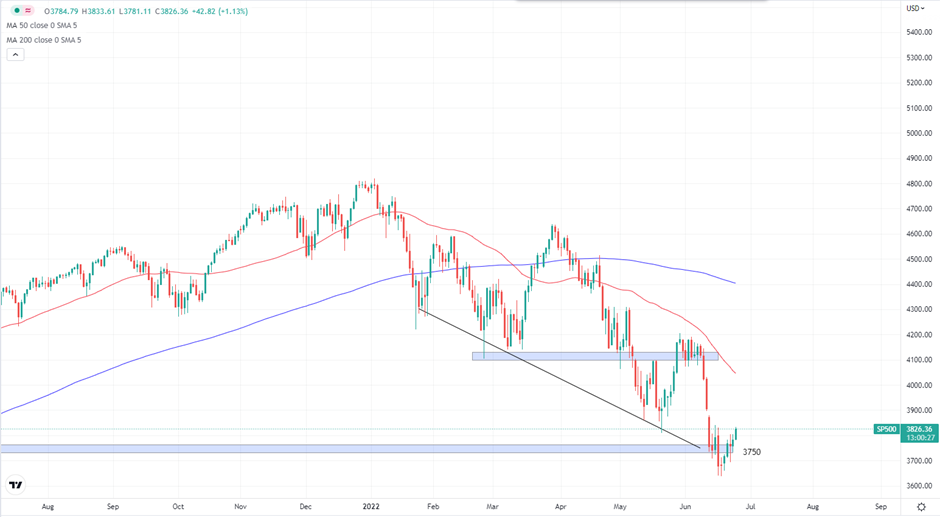
SP500 Daily Chart
SP500 is slowly recovering to trade above 3750 again after 2 consecutive weeks with more than a 5% loss. If the index can hold on to its gains later during the NY session then we will be looking at a green week. The next key level to watch out for is 4000 which will most likely coincide with the 50 daily moving average.
Fed Chair Jerome Powell toned down his language when he testified before the lawmakers on Thursday, stating that the Fed is “strongly committed” to fighting inflation compared to the term “unconditional” that was used previously.
Cryptocurrencies
Bitcoin

BTCUSD Weekly Chart
Having lost 70% of its value from its all-time-high, market-leading cryptocurrency Bitcoin is hanging on to its life. With the strong bearish momentum that is building up, we are doubting if 20000 can hold. The next key price will be its first all-time-high at 19k ish.
Welf
Trader, Technical Analyst
________________________________________________________________________________________
Don’t miss out on BIG market moves!
Want to trade more than 300+ instruments with raw spreads starting from 0 pip and commissions as low as $2 per lot per side?
Sign up with FXPIG now!


