
Economic Calendar
| Day | Events |
| Monday | G7 Meeting |
| Tuesday | G7 Meeting |
| Wednesday | ECB’s Lagarde, BOE’s Bailey and Fed’s Powell speaks |
| Thursday | Core PCE Price Index |
| Friday | ISM Manufacturing PMI, Canadian Bank Holiday |
Headlines
Russia defaulted on its foreign-currency sovereign debt of about $100 Million. G7 to ban Russian gold.
Fed’s Bullard said a rapid rise in interest rates now is the best way to avoid recession later.
Forex
EURUSD
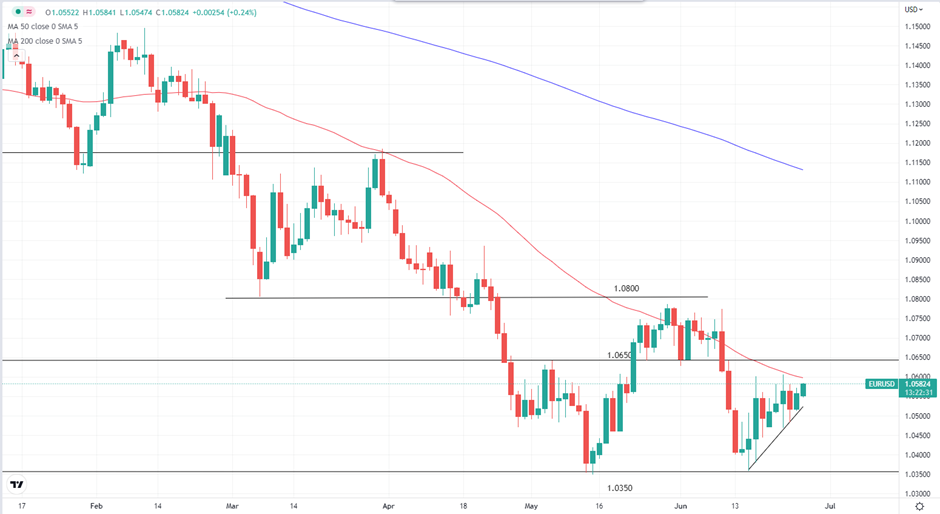
EURUSD Daily Chart
EURUSD is getting a good start for the week as it rose 0.24% before the European session begins. However, 50 DMA and 1.0650 will be the first line of resistance for the bulls. If USD strength resumes, we may see the pair move down to test 1.0350 again. Also, it is the final few days before the second quarter ends so we expect more volatility in the coming days.
Precious Metal
Gold

XAUUSD H4 Chart
Gold climbed 10 dollars to start the week of trading.
Fierce resistance is keeping gold prices in check. The 50 and 200-period moving averages and a bearish trendline are applying bearish pressure on gold.
If it breaks, we shall see gold testing $1860. However, there is a higher tendency for gold to move downwards as it has been creating lower highs, with $1788 as the short-term target.
Energies
US Crude

USOIL Daily Chart
US Crude recovered to close the previous week at -2.25% while investors remain alert to the potential sanctions and talks on Russian Oil and Gas bans during the G7 meeting. Currently, there is a tug of war between the concern of a potential recession and the pressing supply issues, which are partly relieved by the accelerated output of OPEC+ and a potential revival of the Iran Nuclear Deal.
The midpoint of the range, $105 still provides some support to Oil prices. The probability of the price resuming its bullish trajectory is higher and hence our short-term target at $115.
US Stocks
SP500

SP500 Daily Chart
Big gains last week for the US stocks market with SP500 closed +6.31%. However, it remains in a bearish channel and a 4100 key resistance to break should it wants to recover to where it was at the beginning of the year. Fed Chair Powell, due to speak on Wednesday may cause some market movements this week. The boundaries of the channel will be the immediate support and resistance, and key levels at 3750 and 4100.
Cryptocurrencies
BTCUSD
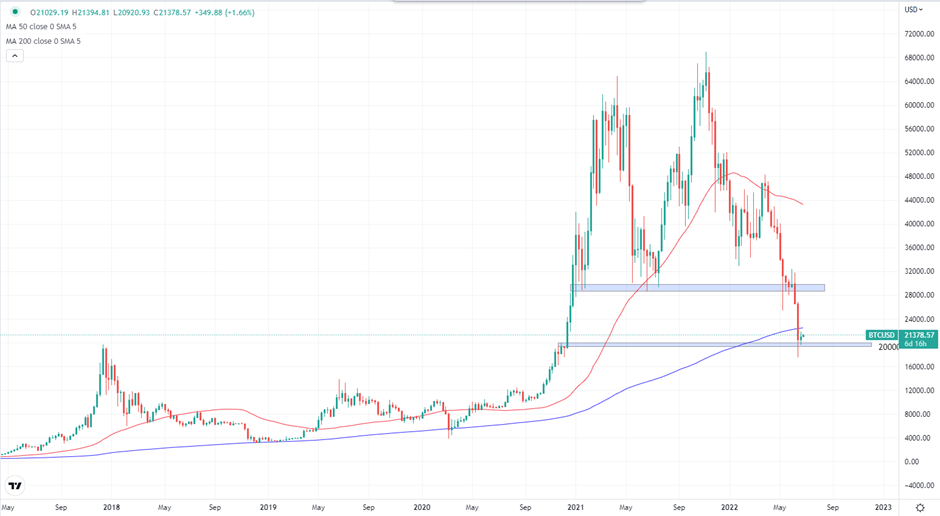
BTCUSD Weekly Chart
Bitcoin was taking a breather from the sharp decline 2 weeks ago. It managed to make a 2.3% gain while holding its ground above the 20k mark.
$20,000 will be the key support while resistance is at the $28,000 area.
Welf
Trader, Technical Analyst
________________________________________________________________________________________
Don’t miss out on BIG market moves!
Want to trade more than 300+ instruments with raw spreads starting from 0 pip and commissions as low as $2 per lot per side?
Sign up with FXPIG now!


