
Economic Calendar
Important Events This Week
Monday- USD Bank Holiday
Wednesday- CAD interest rates
Thursday- GBP, EUR Bank Holiday, ADP Non-Farm Employment Change
Friday- GBP Bank Holiday, NFP
Covid in China
China recorded less than 100 new cases yesterday. Lockdowns may soon be lifted, manufacturing and consumption will be ramped up and global supply chains may not be as tight as it is right now. China’s oil demand will resume and it is good news for oil producers,
Forex
EURUSD
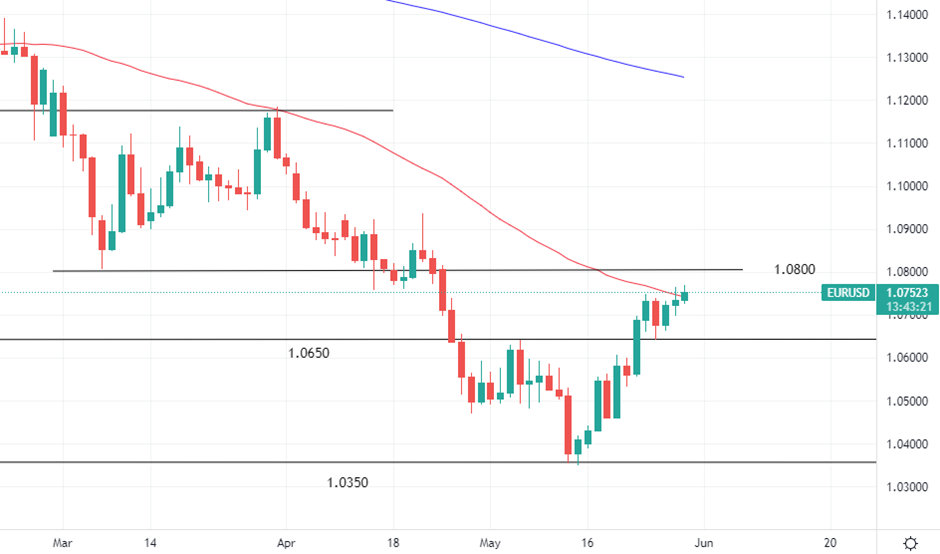
EURUSD Daily Chart
Not much has happened since last Friday. Markets are still slow while we are waiting for the Europe session to begin. Also, note that it is a US Bank holiday so the price may not move much. 50 Daily Moving Average is still keeping the bulls in check, with 1.0800 as its backup. We usually do not trade during bank holidays because volumes are thin, it is better to take a break and sit on the sideline.
Metals
XAUUSD

XAUUSD Daily Chart
Gold is still lingering between the broken trendline and the 200 DMA after ending the previous week with mild gains of 0.36%. As the USD is undergoing a correction phase, gold may continue rising with the 50 DMA acting as a powerful resistance, coinciding with the 1900 key level.
Energies
Crude Oil

USOIL H4 Chart
Crude rallied and set for a positive start for the week.
Factors contributing to the rise include but not limited to:
EU is holding a meeting Monday and Tuesday to discuss a ban on Russian import
- China’s covid related restrictions will be lifted sooner or later as their new daily cases dropped to double-digit
- USD is undergoing a correction, which means it is cheaper for oil importers holding other currencies
In terms of technicals, the price is testing the $115 upper barrier and the likelihood of it breaking is very high. If it breaks, crude may test the previous decade-high at $129.
US Stocks
SP500
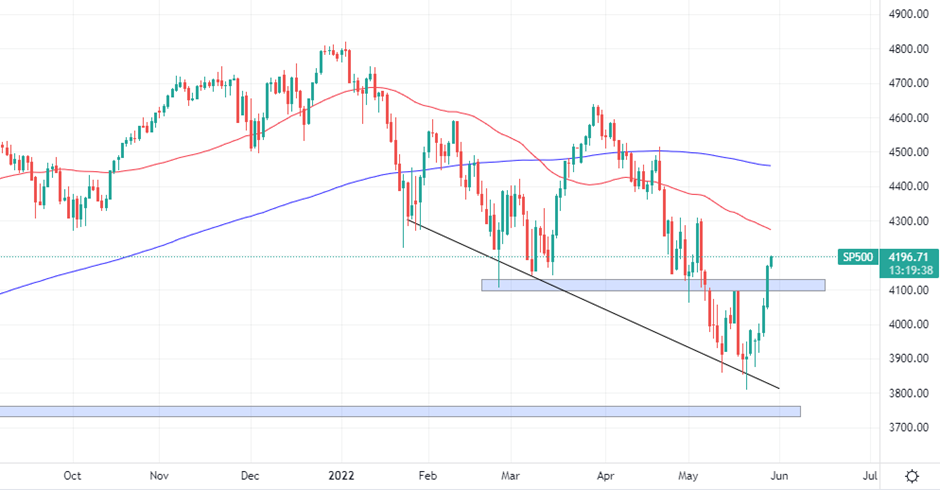
SP500 Daily Chart
Investors breathe a sigh of relief as the stocks market finally closed the week in green after 7 consecutive losing weeks. It broke and closed above 4100 resistance which is a good sign that it may extend the rebound. However, the 50 DMA will be met shortly, coinciding with 4300 level. Inflationary concerns remain although the previous print was showing improvements. The Fed is expected to continue the rate hike all throughout this year which may weigh on the current bullish momentum.
Cryptocurrencies
Bitcoin

BTCUSD Daily Chart
Bitcoin closed the previous week in loss, adding to its 8-week losing streak (Suprise, this is the longest losing streak that Bitcoin has ever been in). Nothing much happened over the weekend and Bitcoin is still consolidating between $28000 and $32000. Looking at the overall technical picture, we make a brave prediction that the bearish momentum may continue and Bitcoin is going down to test $19500 (its first all-time high made back in 2017).
Welf
Trader, Technical Analyst
________________________________________________________________________________________________________________
Don’t miss out on BIG market moves!
Want to trade more than 300+ instruments with raw spreads starting from 0 pip and commissions as low as $2 per lot per side?
Sign up with FXPIG now!


