Economic calendar
Wednesday- OPEC meeting, USD CPI
Thursday- USD PPI
The main economic event for the week will be the US inflation data, coming out at 8:30 AM EST on Wednesday.

According to Trading Central's Economic Insight, the Core inflation is expected to slow down to 6.2% versus the previous print of 6.5%, easing inflationary concerns as the Fed continues to raise interest rates
EURUSD
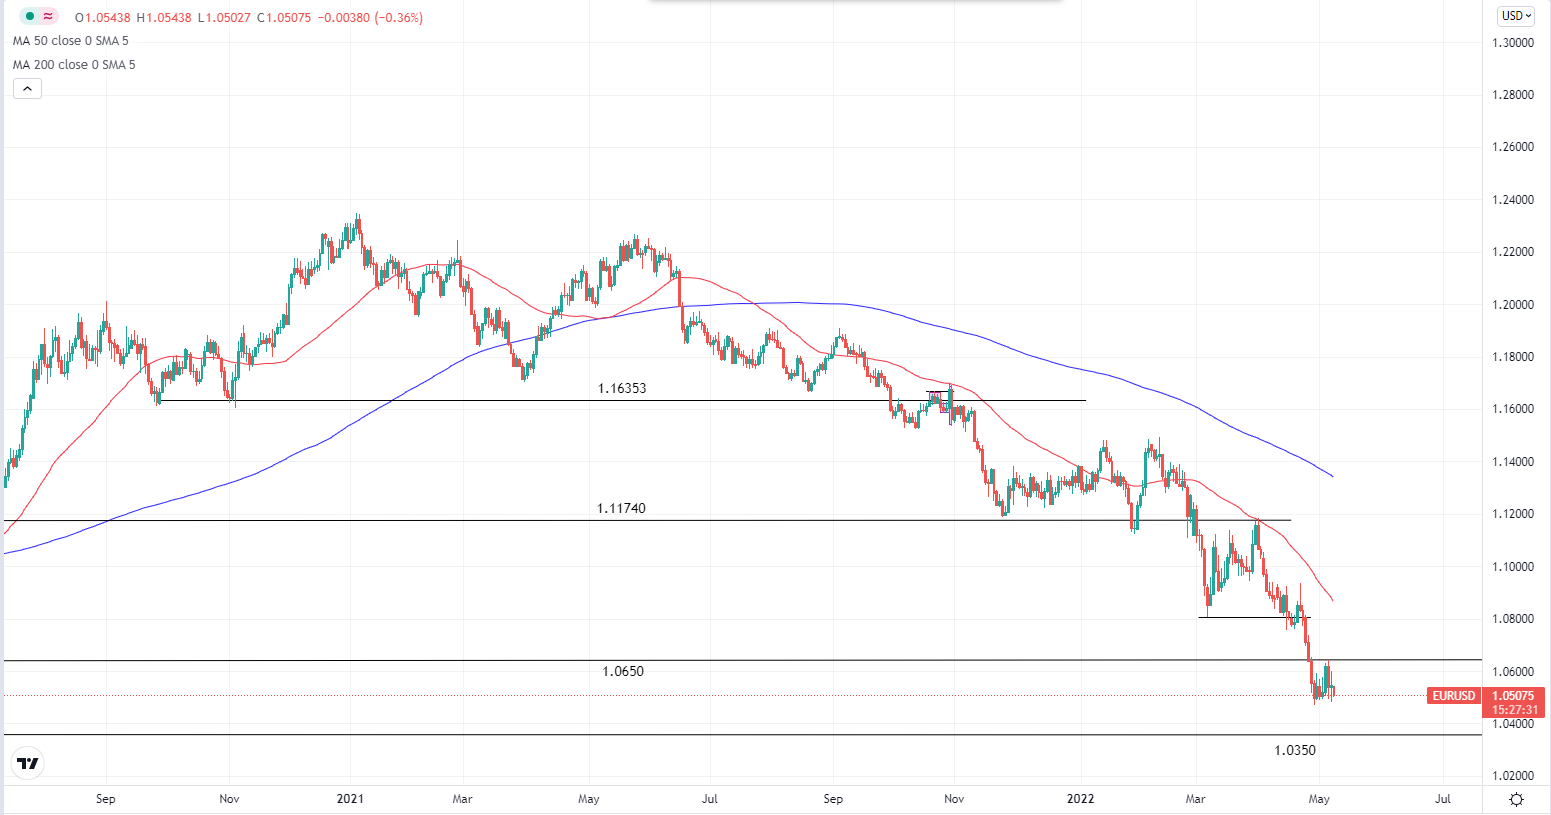
EURUSD Daily Chart. Source: Tradingview
EURUSD traded lower during the early Asian session and is now testing the 1.0500 key level again. Sentiment remains bearish with 1.0650 acting as the first resistance and a short-term target at 1.0350.
XAUUSD

XAUUSD H4 Chart. Source: Tradingview
NFP came out slightly better than forecast with a print of 428k versus 390k and there weren’t much directional movements in gold following the release. Its outlook remains bearish where the trendline is still intact and the price is trading below both moving averages. 1850 will be the next key level that we are looking at should gold continues to trade lower as we wait for European’s trading volume to kick in. In the meantime, higher interest rates is keeping gold prices in check.
Crude Oil
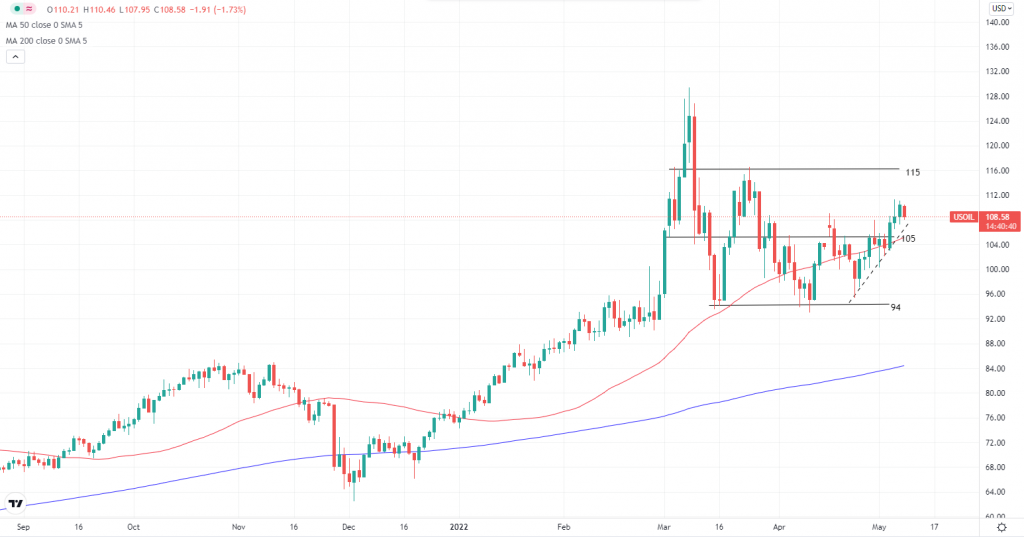
Crude Oil Daily. Source: Tradingview
Crude oil slips as investors are concerned about weakening oil demand due to a global recession fear. Lockdowns in China certainly did not help while Aramco cut its oil prices from record highs for Asia. From a technical perspective, a bullish trendline together with $105 and 50 daily moving average will be the first line of support for oil prices. We are eyeing for the upcoming embargo on Russian oil by the EU which could push prices up.
US Stocks markets

SP500 Daily. Source: Tradingview
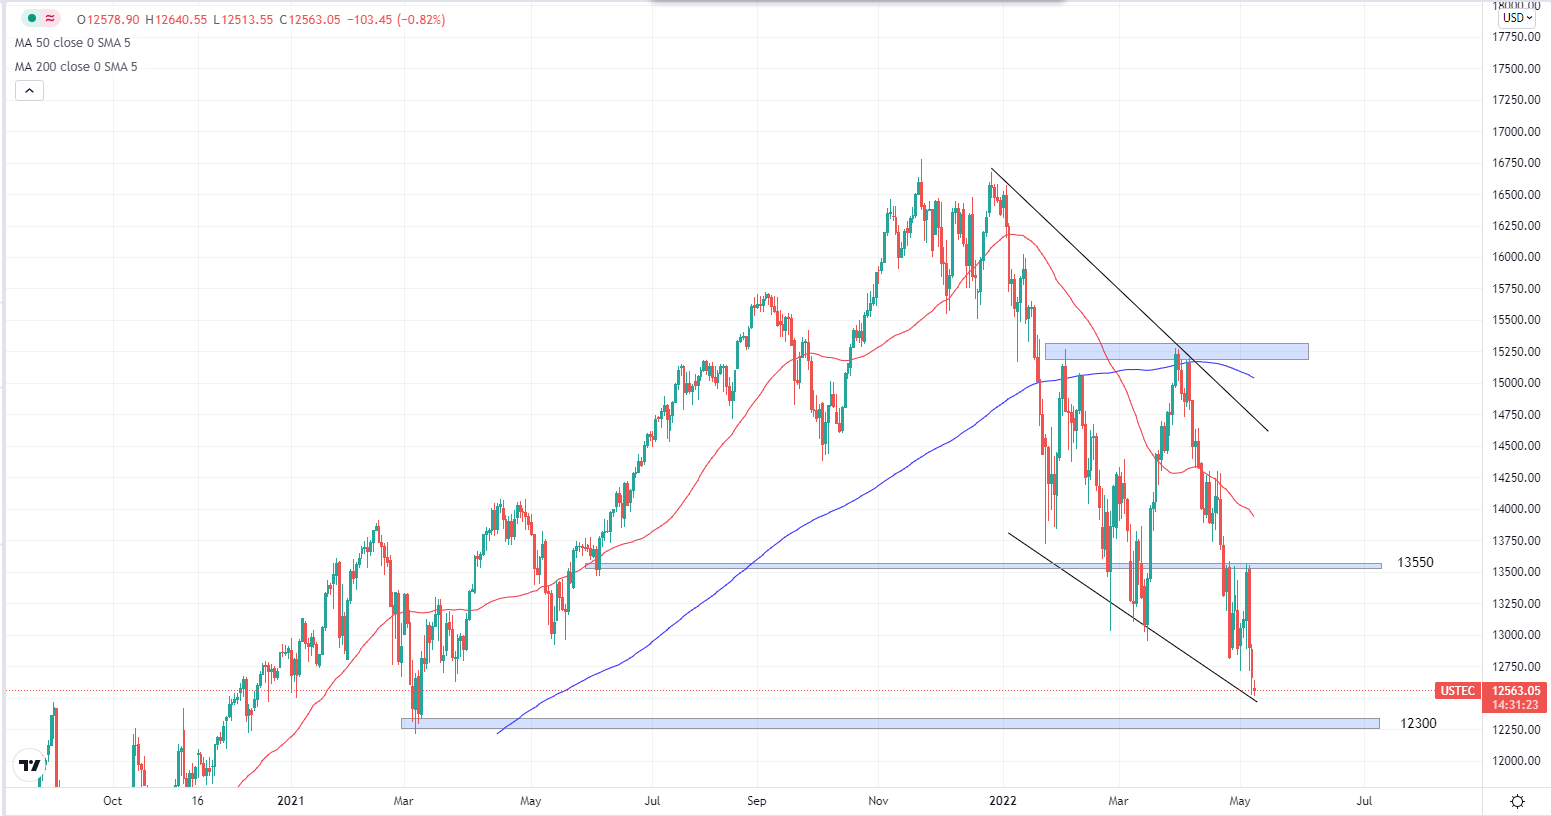
USTEC Daily. Source: Tradingview
SP500 closed down 0.57% while Nasdaq fell 1.84% to end the previous trading week, following market reactions to a raise in US interest rates and better than expected job numbers.
Considering the strong bearish momentum of the stocks markets (SP500 closed the past 5 consecutive weeks in loss), SP500 is most likely testing 4000 key level this week while Nasdaq may see some reaction at the 12300 level.
Cryptocurrencies
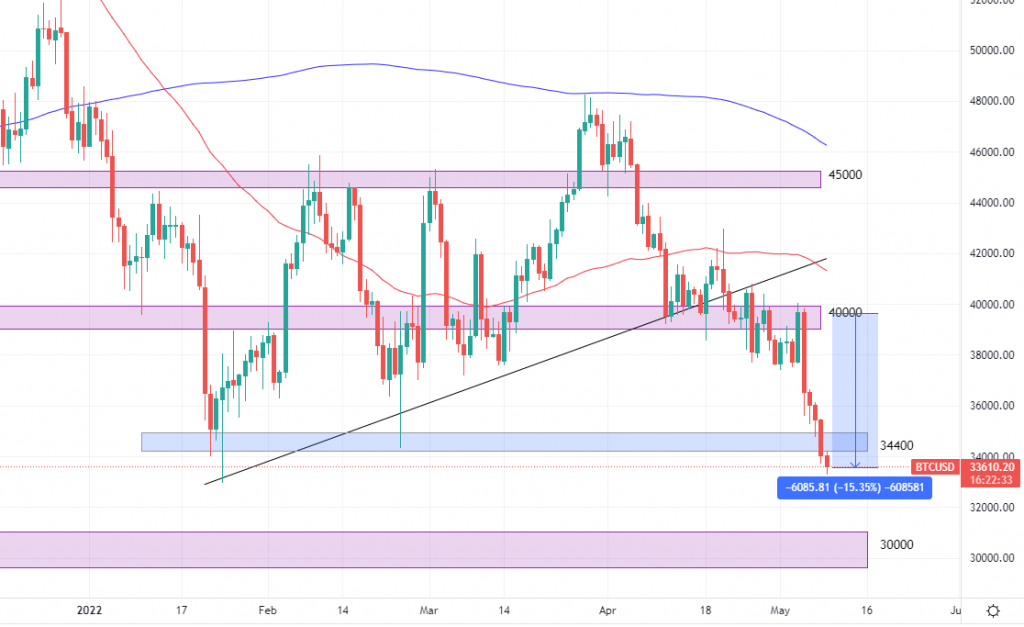
BTCUSD Daily. Source: Tradingview
Finally, there are some solid moves in Bitcoin, although it is not good news for the bulls. It dropped more than 15% in the past 5 days and is currently trading sub $35k. The next big level to watch out for is $30k and we expect some higher than usual volatility there as it is a major area.
BreadMaker
Trader, Technical Analyst
Sign up at FXPIG now and trade with raw spreads starting from 0 pip and commissions as low as $2 per lot per side!


