
USDJPY touched a 20-year high during early morning trading on Wednesday as a strong US CPI print overnight (CPI 1.2% vs 1.2% estimated – Core CPI 0.3% vs 0.5% estimated) help to fuel bets that the Fed will in fact raise interest rates by 0.50% at their next meeting. With the BOJ sticking to a dovish outlook, and interest rate expectations flying higher in the US, traders could see further gains in USDJPY.
From the chart above (USDJPY Weekly), we can see that USDJPY has just breached past 125 key levels with strong bullish momentum. The last time USDJPY traded at these levels was back in May 2002. What does this mean?
Even the financial crisis in 2008 did not make the Yen as weak as it currently is.
Further stoking gains, sentiment and client positioning readings across multiple sources show that retail traders are net short USDJPY by a factor of 4:1. When client positioning is very one-sided like this, it can be used as a contrarian indicator. This is especially true when multiple pairs are showing the same sentiment (currently EURUSD, USDJPY and GBPUSD are all showing strong USD selling by a factor of at least 3:1). For clients looking to access sentiment data, FXPIG offers this for free for all clients in the client portal under “trading tools”. If you are interested, do not hesitate to jump on our live chat and our support staff will provide full guidance.
Moving forward, US PPI and Core PPI data is due out later today. If we see a strong print and USDJPY is able to close above 126 on the daily chart, we could see the 130.00 handles in play over the next 1-2 months. Alternatively, if 126 is rejected and USDJPY closes below 125.50, we could see the pair consolidate and trade in a range between 125 and 120.
GBPUSD – holding support for now
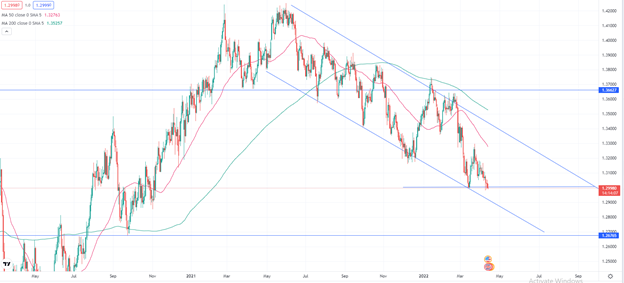
GBPUSD Daily
While England’s CPI and PPI data all printed significantly higher today, (CPI y/y 7% vs 6.7% estimate), it is the USD that is remaining in the spotlight and driving the GBPUSD further. With 1.30000 holding as strong support, GBPUSD needs to close and rally above 1.30000 if GBP is to see any further gains. A fall and close below 1.30000 could lead GBPUSD to 1.2850 or 1.28000. Retail traders are also net-long GBPUSD by a factor of 3:1, which as a contrarian indicator is signaling further downside. GBPUSD is also trading below its 50 and 200-period moving averages on a daily chart.
We can also see the pair trading in a bearish channel on the daily timeframe and the price is just flirting with the previous swing low at 1.3000.
What are your thoughts on these two pairs?
BigWhale
Trader, Technical Analyst


