Economic calendar -Week 31
| Day | Events |
| Monday | Australia, Switzerland, Canada Bank Holiday; US ISM Manufacturing PMI |
| Tuesday | AUD Interest Rates |
| Wednesday | US ISM Services PMI, OPEC+ |
| Thursday | GBP Monetary Policy Report, GBP Rate Statement |
| Friday | RBA Monetary Policy Statement, NFP |
*Only key events are listed
As the Fed raised their interest rates last week, it’s the turn for RBA (Australia) and BOE (UK) this week, with both of them expected to hike their interest rates by 50bps. NFP is also out on Friday and the numbers will be crucial as the Fed has been using the strong job numbers as one of the factors to back their interest rate hike. A weaker job number may deter the Fed from raising rates as aggressively in their September meeting. As for the energy sector, OPEC+ is going to hold a meeting on the 3rd of August, and investors should pay attention to their production plan and their outlook on the energy market, crude oil in particular.
Interest Rates Frenzy
A 50bps rate hike is expected from RBA on Tuesday to bring the cash rate to 1.85% with the main reason for cooling inflation. The inflation printed 6.1% YoY in Q2, which was lower than the expected 6.2%, which subsequently reduced the possibility of a 75 bps hike.
AUDUSD

AUDUSD Daily Chart
AUDUSD has been edging higher for 2 weeks from its previous swing low at 0.6700. Currently testing 0.7060 resistance and the upper boundary of the channel, the chance of a breakout is fairly low as the market has most likely priced in a 50bps hike by the RBA later this week. However, a breakout might be imminent if RBA makes a surprise move to raise rates by more than the general forecast.
| Technical Levels | Price Zone |
| R2 | 0.7270 |
| R1 | 0.7060 |
| S1 | 0.6840 |
| S2 | 0.6700 |
GBPUSD
The BOE is expected to increase its interest rates to 1.75% (a 50bps hike) at its Thursday meeting. Inflation is way worse at 9.4% YoY in June compared to Australia’s. Referring back to what was been mentioned in the last meeting, it was stated that a more forceful action might be taken if it is necessary to keep inflation in check. Will the BOE announce a 75bps hike? A full point hike?

GBPUSD H4 Chart
The Cable has been trailing the path of our scenario 1 decently. It broke out from its bearish trendline, made a retest, picked up steam, and bounced away from the support. It was a very textbook trade.
However, the pressing question now is whether the Pound can sustain its bullish momentum until the interest rate announcement on Thursday. Some supporting confluences for the bulls include the position of the Moving averages with a cross-over in sight. Also, the pair has been making higher lows as it moved away from the support at 1.1925.
1.2400 will be a key resistance area to determine if the pair can move into bullish territory.
| Technical Levels | Price Zone |
| R2 | 1.2659 |
| R1 | 1.2400 |
| S1 | 1.1925 |
| S2 | 1.1760 |
Energies
WTI Crude

USOIL Daily Chart
US Crude breached the $100 mark briefly on Friday but the buyers couldn’t hold the price above that level and we observed a very clean wick above the $98.50 resistance level. To start the week, Oil traded lower during the Asia session, -0.8% at the time of writing. Trading volume may be lower today, affected by Canadian Bank Holiday and also the upcoming OPEC+ Meeting on Wednesday. We have discussed this before but I will mention it again, the President of the United States has recently visited Saudi Arabia to talk about oil production among other topics, and it could ease the strain on the oil supply and prevent oil prices from rallying too high in the short term.
| Technical Levels | Price Zone |
| R2 | 105.00 |
| R1 | 98.50 |
| S1 | 94.00 |
| S2 | 90.00 |
Precious Metals
Gold
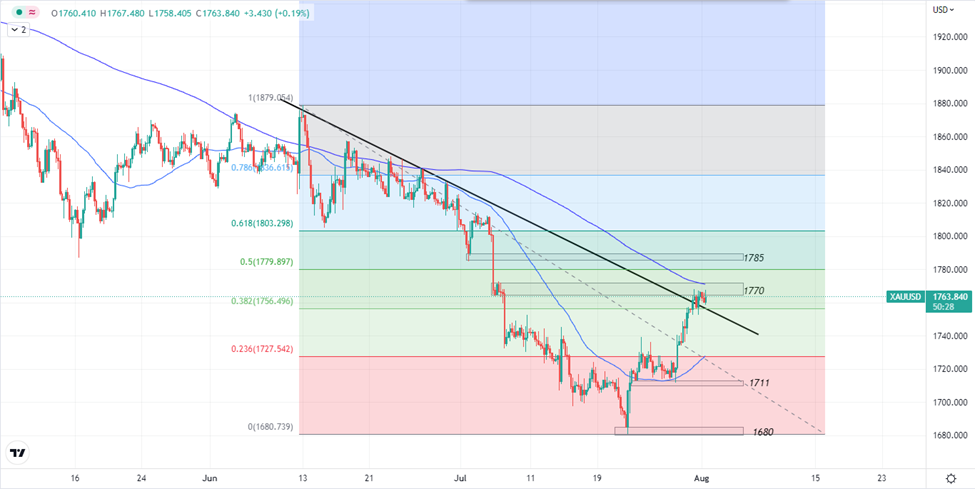
XAUUSD H4 Chart
Gold steadies above $1750 and the .382 Fibonacci level after its rally from the FOMC announcement. Momentum is pausing briefly as it breaks through the trendline and tests the 1770 resistance. The 200-period moving average is also in the way of the buyers. Investors may be waiting on the sideline for the PMIs on Monday and Wednesday. But more importantly, we should eye for the NFP this Friday as the consensus is significantly lower than the previous month’s data. NFP is one of the biggest catalysts for gold prices.
| Technical Levels | Price Zone |
| R2 | 1785 |
| R1 | 1770 |
| S1 | 1711 |
| S2 | 1680 |
US Stocks Market
Nasdaq 100
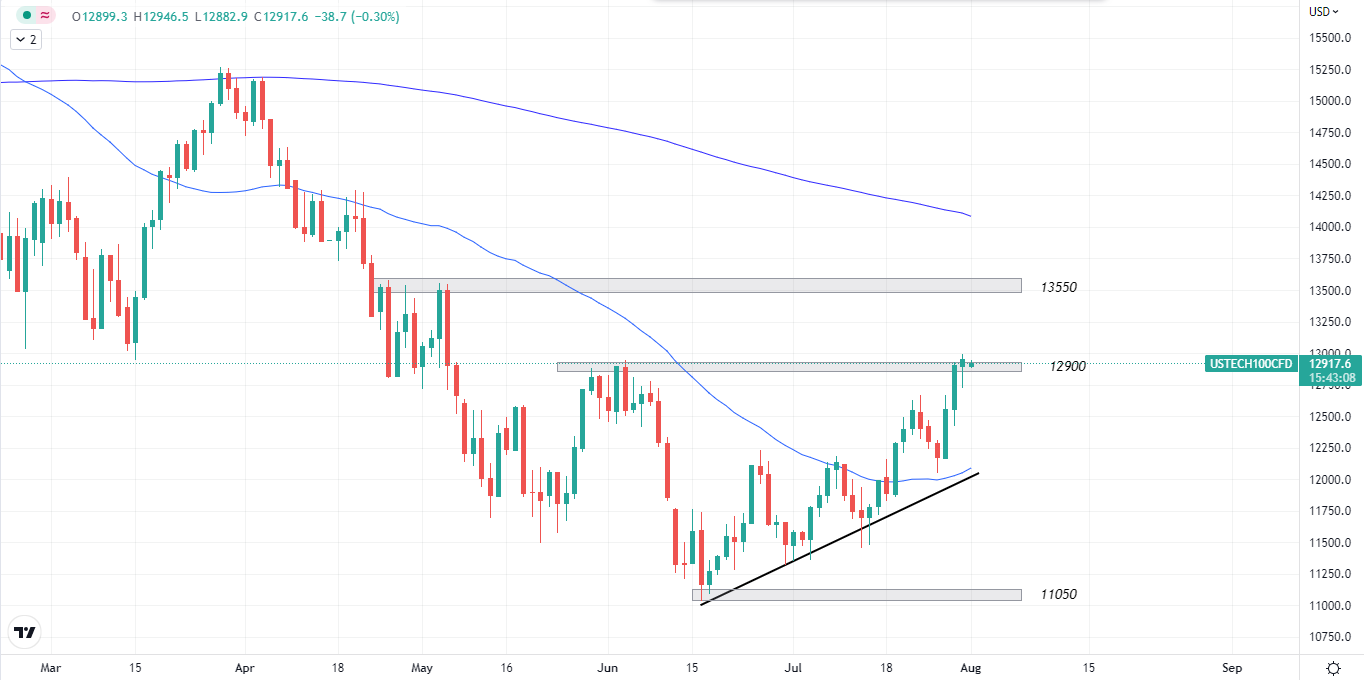
USTEC Daily Chart
Earnings season is coming through with most companies posting better than expected gains in Q2 including AAPL, GOOG, and AMZN which sent USTEC higher. Currently faced with 12900 resistance, it is very likely for it to break through it, considering the strong bullish candles for last week. The next level that we aim for is 13550. The downside is firmly supported by the bullish trendline and the 50-day moving average.
| Technical Levels | Price Zone |
| R2 | 1820 |
| R1 | 1810 |
| S1 | 1790 |
| S2 | 1770 |
Welf
Trader, Technical Analyst
________________________________________________________________________________________
Don’t miss out on BIG market moves!
Want to trade more than 300+ instruments with raw spreads starting from 0 pip and commissions as low as $2 per lot per side?
Sign up with FXPIG now!


