Economic Calendar
Long weekend in the US, Europe, and most of Asia. Thinner volumes and increased volatility in the markets so be sure to trade safely.
XAUUSDGOLD Daily
After a six days gaining streak, the yellow metal is trading above its resistance in the 1970 area. Gold is a mixed bag right now as on one hand there is Fed’s continuous rate hike weighing on gold prices, and on the other hand, we have geopolitical tensions supporting gold’s demand. There is no trading today as Banks are closed, and we are expecting higher volatility with thinner volumes next Monday (still a Bank Holiday for most major economies)
If gold can break through 1970 successfully, we are looking at $2000 psychological level, while the downside is supported by the 50-day moving average.
Crude Oil
USOIL H4
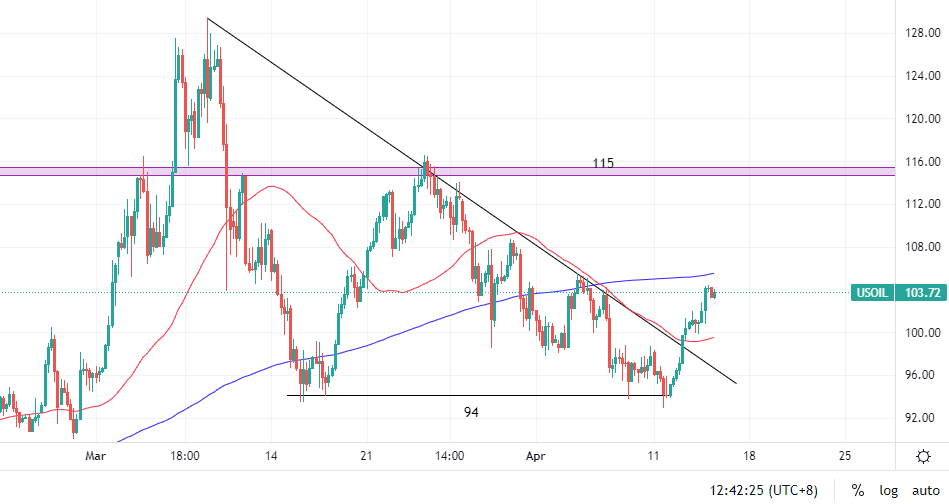
US Crude is trading at triple digits again after breaking through its bearish trendline.
There is a potential trade idea here when the 50 MA crosses above the 200MA. Swift recovery for China’s covid cases is one of the bullish fundamental confluences that we are waiting for.
The downside is supported by 50MA at the moment, while 200MA is the minor resistance and $115 is the next key resistance.
USDJPY
USDJPY H4
Dollar yen continues to advance after hitting a 20-year high earlier this week and it has already gained 60 pips since the market opened today.
The chart above is taken from FXPIG’s cTrader platform and if you notice there are red and green bars below the one-click trading button.
The bar represents the clients’ sentiment. The relatively huge red bar indicates that an overwhelming majority of retail traders are actually shorting the pair right now. It is a great contrarian tool to use as retail traders are wrong most of the time.
As short positions get liquidated when the price moves higher, the ratio (the bar) is going to reduce back to around 50.
Technical levels are 130 for the mid to long-term target, while the previous swing high at 125.70 will act as the next level of support.
SP500

SP500 Weekly
It was a losing week for the US stocks market with SP500 down 2.13%, Dow Jones down 0.72%, and Nasdaq down 2.94%.
.
USTEC
Nasdaq Daily
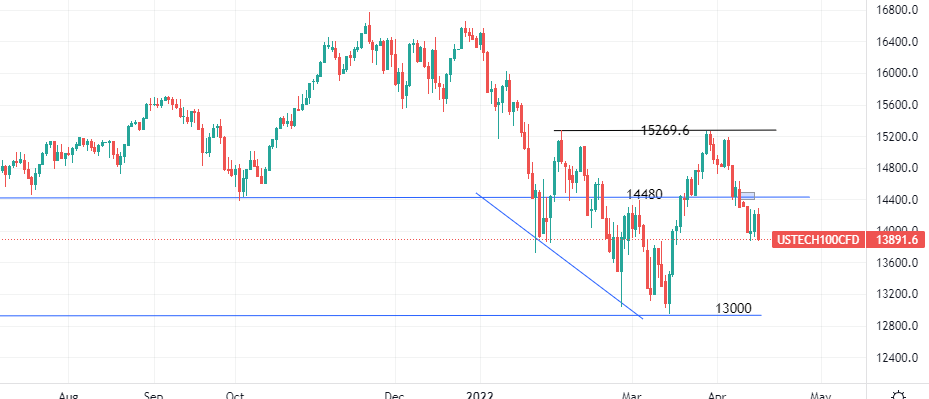
After making a double top formation, USTEC is reversing to the downside with 13000 as the next key support.
.
BTCUSD
BTCUSD Daily
Bitcoin attempted a bullish run after breaking through its triangle formation. However, the bulls did not have enough fuel to hold on and the momentum died. It came back down and breached below the $40000 level briefly and is now trading just above that level. Back to the junction, we are still looking for any directional guide for Bitcoin.
Welf
Trader, Technical Analyst
USDJPY touched a 20-year high during early morning trading on Wednesday as a strong US CPI print overnight (CPI 1.2% vs 1.2% estimated – Core CPI 0.3% vs 0.5% estimated) help to fuel bets that the Fed will in fact raise interest rates by 0.50% at their next meeting. With the BOJ sticking to a dovish outlook, and interest rate expectations flying higher in the US, traders could see further gains in USDJPY.
From the chart above (USDJPY Weekly), we can see that USDJPY has just breached past 125 key levels with strong bullish momentum. The last time USDJPY traded at these levels was back in May 2002. What does this mean?
Even the financial crisis in 2008 did not make the Yen as weak as it currently is.
Further stoking gains, sentiment and client positioning readings across multiple sources show that retail traders are net short USDJPY by a factor of 4:1. When client positioning is very one-sided like this, it can be used as a contrarian indicator. This is especially true when multiple pairs are showing the same sentiment (currently EURUSD, USDJPY and GBPUSD are all showing strong USD selling by a factor of at least 3:1). For clients looking to access sentiment data, FXPIG offers this for free for all clients in the client portal under “trading tools”. If you are interested, do not hesitate to jump on our live chat and our support staff will provide full guidance.
Moving forward, US PPI and Core PPI data is due out later today. If we see a strong print and USDJPY is able to close above 126 on the daily chart, we could see the 130.00 handles in play over the next 1-2 months. Alternatively, if 126 is rejected and USDJPY closes below 125.50, we could see the pair consolidate and trade in a range between 125 and 120.
GBPUSD – holding support for now
GBPUSD Daily
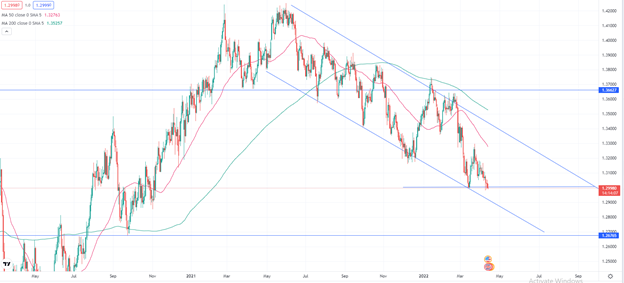
While England’s CPI and PPI data all printed significantly higher today, (CPI y/y 7% vs 6.7% estimate), it is the USD that is remaining in the spotlight and driving the GBPUSD further. With 1.30000 holding as strong support, GBPUSD needs to close and rally above 1.30000 if GBP is to see any further gains. A fall and close below 1.30000 could lead GBPUSD to 1.2850 or 1.28000. Retail traders are also net-long GBPUSD by a factor of 3:1, which as a contrarian indicator is signaling further downside. GBPUSD is also trading below its 50 and 200-period moving averages on a daily chart.
We can also see the pair trading in a bearish channel on the daily timeframe and the price is just flirting with the previous swing low at 1.3000.
What are your thoughts on these two pairs?
BigWhale
Trader, Technical Analyst
With inflation on everyone’s mind, today’s US CPI print is a must-watch event for traders. This announcement should help confirm to the Fed if a 50 basis point hike is needed at their next meeting, which would further boost the USD compared to other pairs.
EURUSD
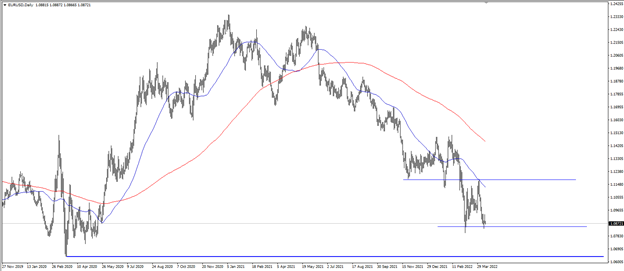
Looking at EURUSD, we have seen a steady downtrend since May 2021 on the daily chart, with the 50 period SMA providing much resistance to any bullish moves in the pair. Trading at the lows for the year at 1.08780, a strong CPI print in the US could push EURUSD down to the support of 1.0640, which was the low for 2020. If we see CPI figures come in lower than expected, we expect EURUSD to rally with resistance either at the 50 period SMA or 1.1180 (previous support from Nov – March).
GBPUSD
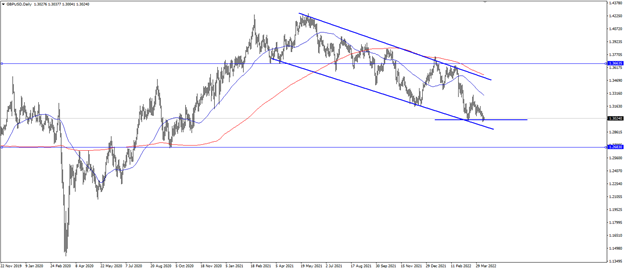
Similar to EURUSD, GBPUSD has been trading in a downward channel on the daily chart since early May 2021 and is currently trading at 2-year lows of 1.30242 at the time of this writing. With 1.30000 being a big figure and showing support, traders should keep an eye out for any surprises in US CPI. If CPI prints higher inflation than expected, we could see new lows for the year in GBPUSD if it breaks below 1.30000. The next support should be in the 1.2675 level on the daily chart.
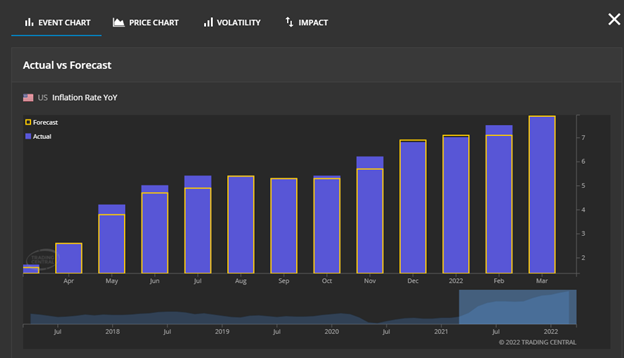
The cool chart above is a snapshot from Trading Central’s Economic Insight. This tool is super useful where it displays the historical figures of various economic events.
From the chart, we can see that the inflation numbers have been on the rise in the past 12 months. To get a feel of how the actual print is going to look like compared to forecast, let’s look at the historical trend.
From the past 12 reports, 6 of them exceeded the forecast figure, 4 of them matched forecast while 2 of the actual numbers were lower than expected. We can then make an inference that the actual number is more likely to be greater than analysts’ forecast.
Want free access to Economic Insight and many more trading tools from Trading Central?
Sign up with FXPIG now!
BigWhale
Trader, Technical Analyst
Economic Calendar
Tuesday- US CPI
Wednesday- GBP CPI, New Zealand, and Canada Interest Rate decision, Crude oil inventories
Thursday- EUR monetary policy statement
Good Friday- All major banks closed
Important Headlines
Another China property developer ZHENRO defaults on its bond interest payment and Fitch Ratings downgraded Zhenro to restricted default. The company said that its operations have been halted in the past few weeks due to the lockdowns in Shanghai.
Elon Musk declined the offer for a seat at Twitter’s board after becoming the single largest shareholder in the social media platform with just over 9% share ownership.
Technical Analysis
XAUUSD
XAUUSD H4
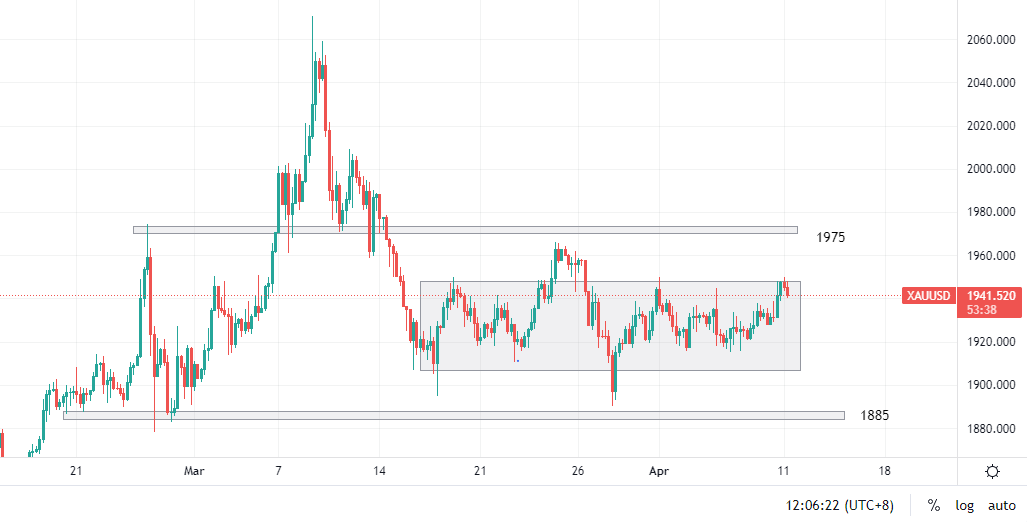
Gold edged lower from its upper boundary since the Asian open and is trading around the $1940 area.
Our prediction is another fakeout to the upside before heading for a bearish run.
To support our outlook is the Fed continuous rate hike, a stronger dollar and the de-escalation of the Ukraine-Russia war with Moscow spokesperson stated that their “special operation” could be completed soon as objectives have been met.
OIL

USOIL H4
US Crude is ranging above its support at $94. The possibility of a downwards breakout is very likely as the price was making lower highs.
Fundamentals are also bearish for Crude as nations announced oil releases from the strategic reserve. As the biggest importer of Oil, China’s covid situation has not improved with 26000 cases in Shanghai yesterday. With supply increasing and demand dropping, oil price is destined to fall in the short term (in a textbook scenario).
EURUSD

EURUSD H4
The Euro fell against the dollar as Asia opened and the fiber is approaching its key support at 1.0850. CPI and ECB will take center stage this week with CPI on Tuesday and EUR monetary policy statement and press conference on Thursday.
While waiting for market-moving catalysts, the key levels are 1.1174 resistance and 1.0650 support.
USDJPY

USDJPY H2
USDJPY bounced off strongly from its bullish trendline once market opened this morning. As of writing, it has rallied for 100 pips and the European session hasn’t even started. Testing 125 key resistance which was formed about 2 weeks ago, if it breaks we are seeing 125.85, a weekly swing high from 7 years ago. On the other hand, downside is supported by its trendline and the consolidation zone at 123.5 area.
Our expectations are bullish for the longer term due to the differences in yield between the two currencies and the monetary stances of the respective central banks (Hawkish Fed vs Dovish BOJ)
SP500

SP500 Daily
It was three consecutive days for a slow SP500 as it is getting stucked in the 4500 area and the 200 day moving average is barely providing some support. The US CPI due on Tuesday may limit risk appetite as the forecast figure is raised to 8.3% from the past reading at 7.9%. FOMC may carry out QT at a more aggressive rate with balance sheet trimmed and rate hiked in the very near term.
USTEC
Nasdaq Daily
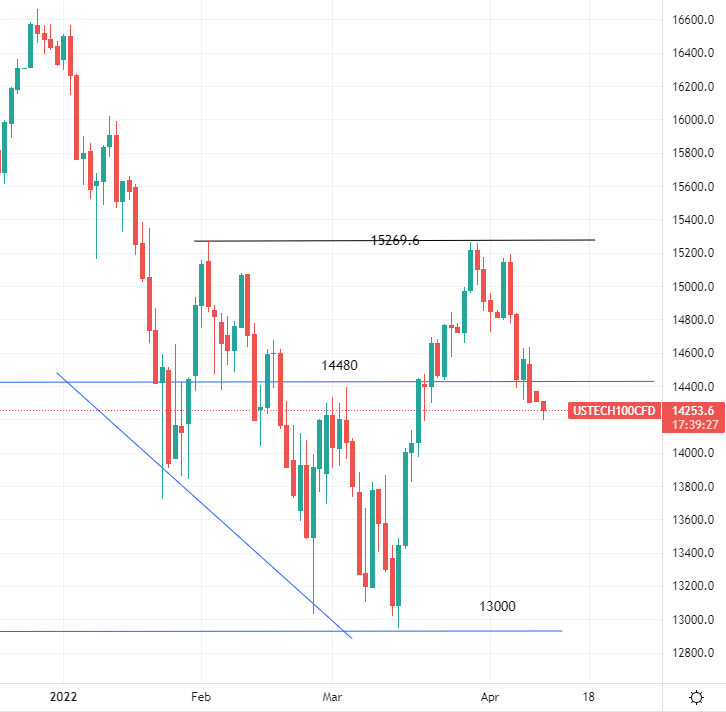
Last Friday we were discussing about a brief bounce from its support, but that didn’t age well. Nasdaq closed below the support for last Friday’s trading and is currently trading at 14250
ETHUSD
ETHUSD Daily
Ethereum failed to close above 3400 resistance and is ranging at the 3100 area for the past 4 days. If Ethereum falls, the daily bullish trendline may coincide with 2750 support level and that could be a great opportunity to go long.
In terms of fundamentals, Ethereum is going to undergo a merge where its mechanism is going to change from proof-of-work (PoW) to proof-of-stake (PoS). Some of the most important implications include:
- The existing mining machine is going to be obsolete
- Ethereum mining is going to be more environmentally friendly as it will consume 99% less energy
Mark Cuban is one of the public figures that are extremely bullish on this change.
Welf
Trader, Technical Analyst
Economic Calendar
No important announcements to end the week. French presidential election on Sunday.
Important Headlines
Shanghai lockdown is continuing to affect the global economy due to logistical and manufacturing limitations among many other factors. Flight activity to Shanghai Pudong Airport is only 3% of the previous month’s and air cargo shipments are restricted to necessary goods such as medicine. It is still unclear when the measures will be eased as cases hit record numbers for 6 consecutive days, standing at almost 20000 cases yesterday
The previous month’s FOMC Meeting minutes indicated that the Fed will consider a half-percentage-points step at upcoming meetings if inflation remains high. Therefore, we should keep an eye out for the CPI report next Tuesday. The Fed is also planning to shrink its balance sheet by 95 billion dollars a month, starting May.
Technical Analysis
XAUUSD
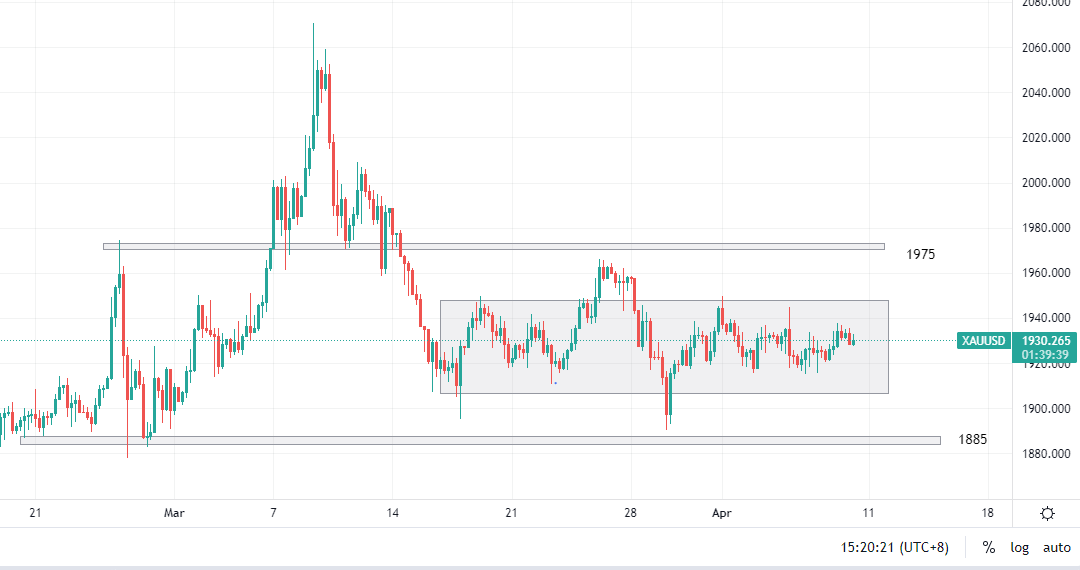
Gold Daily
Gold has been consolidating within a 30 dollar range for more than a week already. And traders should be wary as the likelihood for a huge breakout is very, very high. Technical levels remain the same and are marked on the chart.
OIL
Oil H4
Oil has been making lower highs and lower lows and is in a short-term bearish market structure. It is currently down 8.5% from its weekly high and approaching $94 support. If it fails to hold, we have another support at $89.5.
Fundamentals-wise, planned stockpile release from consuming countries is keeping prices low. However, it is not a long-term solution and is deterring oil producers from increasing output as quickly, although oil price is near triple digits.
EURUSD
EURUSD Weekly
EURUSD drifted lower and is down 1.77% for the week. It is heading towards key support at 1.0850. Is the Euro strong enough to bounce away from support? The bearish outlook remains intact as the market structure is showing lower highs and lower lows since May last year.
USDJPY

USDJPY Daily
USDJPY is set to advance higher after finishing its consolidation on the bullish trendline. The next resistance is the key level at 125 which is only 100 pips away. Will UJ hit the level before CPI next Tuesday?
US stocks markets
Investors have to continuously monitor developments of the war, China’s covid situation, and global inflation amongst many other headwinds that is taking place around the world right now.
SP500

SPX Daily
SP500 has been lingering around the 4500 level for the past 2 days with not much directional movement.
USTEC

Nasdaq Daily
USTEC made a brief bounce from 14480 support during yesterday’s trading, also no significant movement has been observed.
BTCUSD
BTCUSD Daily
As discussed in our previous analysis, Bitcoin was indeed making a fakeout to the upside and is now trading back below the 45000 level. Bearish momentum looks strong as Bitcoin lost 6.3% this week. The next level to look out for is $40000 which somehow acts as a midpoint for bulls and bears.
Welf
Trader, Technical Analyst
Economic Calendar
Tuesday- AUD interest rates
Wednesday- US Crude oil inventories/ FOMC minutes
Important Headlines
USOIL H4
Crude oil is trading below its 4-hour trendline and the key level of $100 is weighing down on its price. As discussed last week, the US is releasing its oil stockpile starting in May while OPEC+ is also increasing its supply. Over the weekend, a truce has also been made between UAE and the Iran Houthi group that would halt military actions on the Saudi-Yemeni border which means a more stable oil supply from the region.
TC Economic Insight
NFP figures matched forecasted pretty well with a print of 431k vs 460k forecasted. It was the first NFP since the rate hike and there wasn’t much impact on the markets as seen in EURUSD.
EURUSD M30
The pair only move 15 pips in 30 minutes following the NFP announcement. However, the pair continued to edge downwards after a fakeout to the upside.
As Asia opened, EURUSD bounced off minor support at 1.1032. If it continues to the downside, we are expecting 1.0975 as the next support.
XAUUSD
XAUUSD H4
The gold market is very indecisive too. It moved in a range lesser than 20 dollars following NFP (it is usually way more volatile than this). Currently, we are waiting for a significant breakout from this 1905-1950 range. The outlook is biased towards bears as bullion is weighed by a firm USD.
USDJPY
USDJPY H1
USDJPY bounced back higher, trading at 122.62 after a correction from its 125 high. We are eyeing for it to break above 123.15 resistance. Why? Because…
The probability for a 50 basis point rate hike in May is almost 70%, which means the dollar is going to get even stronger compared to JPY. Not to forget that the BOJ is also very dovish in its stance.
Source: https://www.cmegroup.com/trading/interest-rates/countdown-to-fomc.html
US Stocks
SP500 closed last Friday with a slight gain of 0.34%, Dow Jones a mere 0.01% gain, while USTEC closed down -0.22%. It was a really, really slow NFP indeed.
SP500
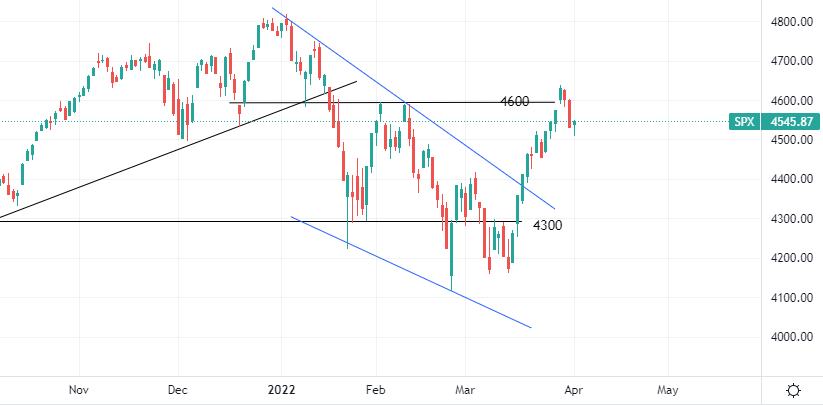
SPX Daily
DJ30
DJ30 Daily
USTEC

USTEC Daily
Since they all didn’t make any significant moves since last Friday, all technical levels from Friday (1/4/2022) remain valid.
BTCUSD
BTCUSD Daily
It has been a full week since Bitcoin broke the 45000 key resistance. However, we are still waiting for any signs of bullishness. Could it be a fakeout, or is it just getting ready to move higher? We will need to wait for the price action in the next few days before any preferences can be made
Welf
Technical Analyst, Trader
Economic Calendar
There are two important reports to end the week and start the new month and the quarter off, the Non-farm payroll and the unemployment rate report. It is highly probable that there will be a lot of price spikes later tonight as investors and financial institutions look to initiate new investment positions
Important Headlines
As Q1 ends, stocks performances were evaluated, and unsurprisingly, the US stocks markets had their worst quarter since the pandemic began and it could be due to a variety of factors including the Russian war and how hawkish the Fed has become
Nasdaq led the losses with a $2 trillion market cap evaporated through Wednesday’s close, while SP500 lost around $1.46 trillion in Q1 2022.
USTEC daily
Nasdaq was down 1.32% yesterday and it is now trading between the 14480 support and 15270 resistance.
SP500 Daily
SPX declined by 1.5% yesterday after failing to break above the resistance level at 4600.
META Weekly
The bulk of the loss in Nasdaq came from Meta, the parent company of Facebook where more than $300 billion was shaved off its market cap with the price declined by as much as half. It has made a minor recovery after bouncing off the trendline, and the next level to watch out for is the $250 key level. Can their VR venture help Meta get their valuation back up?
XAUUSD
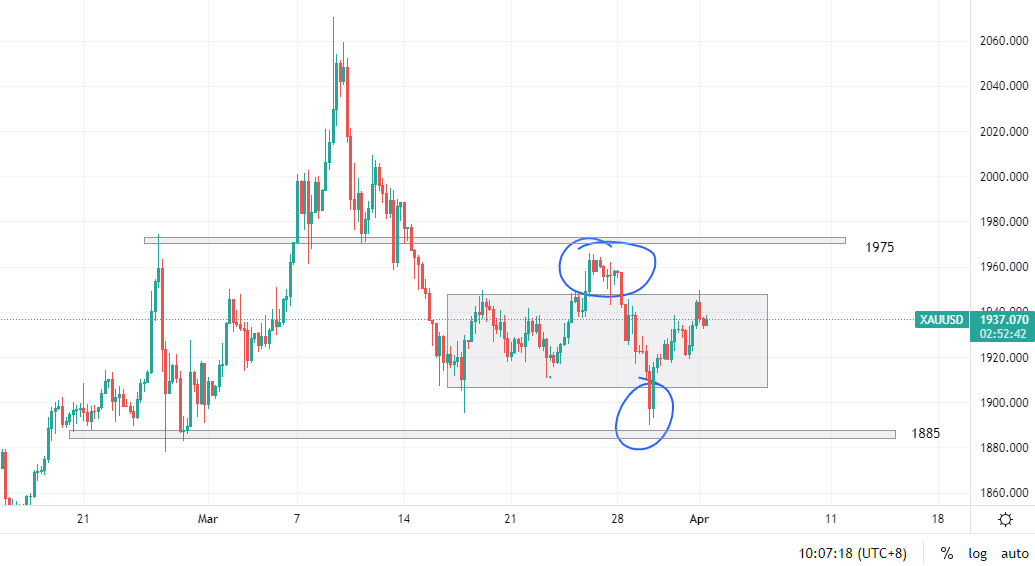
XAUUSD Daily
After faking out to both sides of the range as highlighted by the circles, it is now trading at the upper end of the range. We will have to see what NFP brings tonight, but we can expect some sort of reaction once the price hits either level marked.
OIL

USOIL Daily
After President Joe Biden announced the largest ever release from the U.S. Strategic Petroleum Reserve (1 mln bpd of oil for 6 months starting May), US crude oil slumped as much as 7% and closed at barely above $100 on Thursday. Oil companies were also urged to increase drilling. OPEC+ met yesterday and decided to stick with the plan of increasing supply by 432k bpd starting May.
Technical wise, the trendline is trying its best to hold price. But as the supplies continue to increase, and China’s demand is not resuming at the moment, we could see further decline in oil prices and the next level to eye for is $94.
EURUSD
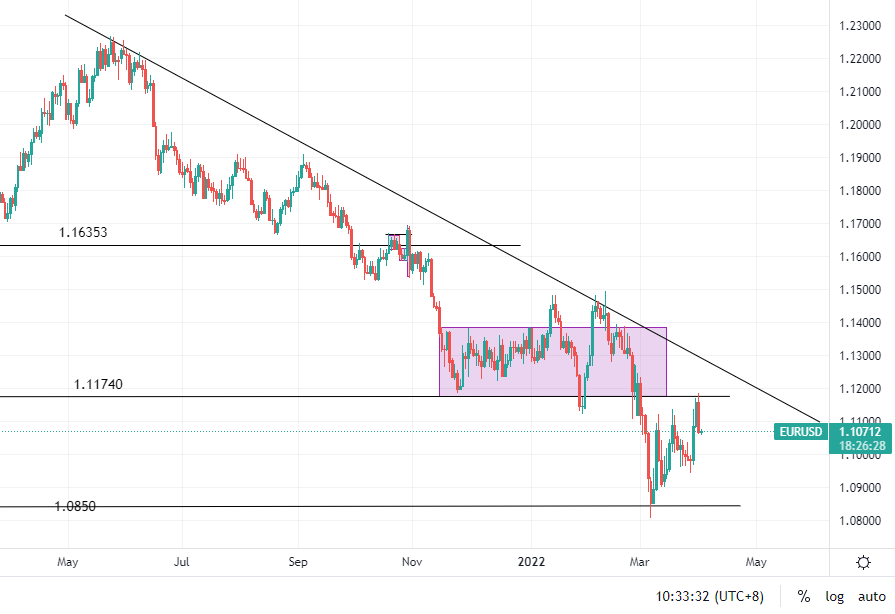
EURUSD Daily
EURUSD respected the resistance perfectly. We can expect some significant moves tonight when NFP is released and the sentiment is still towards the downside as the dollar’s outlook remains strong.
USDJPY H4
USDJPY is well-positioned for a continued climb as it bounces off the 121.34 support with ease. Since Asia opened, we have seen the pair rose by 76 pips already, and the next big catalyst is obviously the NFP tonight, although the impact of NFP is seen not as important with other macros that are going on right now.
BTCUSD
Bitcoin daily
Bitcoin is an interesting one. Is this a potential fakeout? The bullish conviction is not as strong, and we are seeing two huge candles down. It is now trading sub 45k again, and we may see another round of fakeout if the final direction is down.
Welf
Technical Analyst, Trader
According to an SEC filing, Tesla is looking to enable a stock split and will seek approval at its annual shareholder meeting this year to increase the number of authorized shares of common stocks.
The last time Tesla had a stock split was in August 2020 with a 5-for-1 split. Since then, the shares have more than doubled.
Why would a company do a stock split?
We have seen big companies like Alphabet and Amazon splitting their stocks. Some of the benefits of a stock split for investors include easier portfolio management and also lowering the barrier of entry for investors with smaller capital. As for financial performance, the stocks usually outperform the market over the next several years based on a study carried out by Rice University.
NASDAQ: TSLA Daily Chart
If we look at the TSLA chart on the daily timeframe, we can see that it has had a winning streak and bagged gains of more than 30% after breaking through its bearish channel with significant momentum. The rally did not stop even when the company announced a production halt in its Shanghai gigafactory due to covid lockdowns.
Trading at 1090 at the time of writing, it is well-positioned to continue its advance and test 1200 all-time-highs. From a manufacturing perspective, another bullish confluence for Tesla is the greater-than-expected delivery number in Europe and China where it exceeded consensus by more than 15%.
What are your views on Tesla?
Don’t miss out on great market moves! Trade TSLA and a bunch of other stocks at FXPIG now.
Economic Calendar
Wednesday- ADP Non-farm employment change, US Crude Oil Inventories
Friday- NFP and US unemployment rate
Important Headlines
Shanghai’s Lockdown
Shanghai begins its phased lockdown for millions of people to carry out mass testing as covid cases surge to record numbers. Tesla was also one of the affected companies where its gigafactory in Shanghai is suspending production until at least Thursday
TSLA Daily
Tesla’s stocks have had a significant break out from their bearish channel and had an eight-session winning streak with +32% gains. It is also trading above the $1000 key level. The production halt in China may affect its bullish momentum. If the stock retrace back to 900 resistance turned support level, it could be a good buying opportunity. Fundamentals suggest that the stock may still continue its rally as the unit deliveries in Europe and China are exceeding analysts’ consensus by more than 15%.
Bitcoin Weekend Surge
BTCUSD H4
After breaking out from its triangle formation 10 days ago, Bitcoin has been picking up pace in its advance. The move got stronger this morning, and Bitcoin is already up 5% since today’s open. With the fresh bullish sentiment, more than $130 million worth of Bitcoin shorts were liquidated in the past 24 hours.
Technical wise, Bitcoin is finally back to breakeven at the $47k area. It has also broken through 45000 and is heading towards 50000 psychological level.
The Dollar Yen
USDJPY H4
The dollar continued to strengthen against the yen, and the pair has already rallied 174 pips since Asia Open. To put it in perspective, the average daily range of USDJPY is 62.5 pips. It is also tricky to trade in this current situation when this slow-moving pair is up 800 pips since its breakout from 115 resistance, with minimal retracement and its RSI is already in the Oversold territory
The advance can also be contributed to the intervention of BOJ to stop its JGB yield from rising about its key target of 0.25%. As BOJ continues to remain dovish, a hawkish Fed is going to cause a bigger divergence in monetary policies and also in terms of yields, between the dollar and yen. The next big technical level that we are looking at is 125, while support is at its previous swing low at 121.3.
XAUUSD
Gold H1
As mentioned in my previous analysis, gold was indeed faking out and is now trading back into its consolidation range. Looks like everyone is still not convinced in either direction so we will have to wait for the markets to show their hands. Another good long opportunity would be when gold goes back down to test the 1920 support area.
OIL

USOIL H4
Crude oil did not manage to break through 116 resistance and is trading back down towards the 107 support level. Although the short term demand is declining with rising cases in China, the long-term fundamentals may remain bullish for oil as we are still going to lose 3 million barrels of Russian oil per day, and alternatives are not looking promising with the founder of Vanda Insights saying “There’s just no way even OPEC+ and even combined Iran and Venezuela could make up for it”.
EURUSD

EURUSD Daily
EURUSD remains heavy as higher USD yield fuels dollar appreciation against a basket of currencies. Not only that but the rising covid concerns in Germany may add to the euro’s plight as Germany is the biggest economic powerhouse in the EU.
SP500

SP500 Daily
SPX is almost at the 4600 resistance area while Nasdaq’s bullish momentum is slowing down. We will wait for NYSE to open tonight, as there will be major news announcements this week with ADP and NFP coming out
USTEC Daily
The next resistance level will be at 15000 whole level while support is marked at 14480.
Welf
Technical Analyst, Trader
Economic Calendar
There is no more major news for this week, however market volatility may remain high as investors look to flat their positions heading into the weekend.
Important Headlines
OPEC+ is scheduled to meet on 31st March and they may decide to stick with their production plan amid decade-high oil prices and tight supplies. The global economy is very likely to lose 3 million barrels of Russian oil in the near term due to tighter restrictions, while western countries are looking for alternatives such as Iran nuclear deal revival and Venezuelan sanctions being eased
USOIL H4
After bouncing off from the bullish trendline, it may retrace to test 106 resistance turned support level. As oil supplies continue to decline while demand recovers, we may see oil continue its bullish advance. First key level to be tested will be the recent highs at the $130 area. If it breaks, it may head to $150 or even $200 as said by some analysts at S&P Global Commodity Insights.
Technical Analysis
XAUUSD
Gold H4
After consolidating for almost 10 days, gold has finally broken out of the range and is heading upwards. However, the momentum is not as strong, and it could be a fakeout. Traders may look for a long opportunity when the price goes back down to retest the upper boundary.
EURUSD
EURUSD H2
EURUSD has been forming a short-term bullish trendline. Traders may look for opportunities to go short at the next resistance of 1.1120, with the bearish trendline as an added confluence and a first target at the previous swing low (1.0800).
USDJPY
USDJPY Daily
After a fierce rally for more than 2 weeks, USDJPY is down 106 pips since the Asian open. That is a relatively big move for a pair like dollar-yen. However, with the differences in currency yields and their respective national monetary stances, USDJPY is poised for a continued advance. Traders may look for a buying opportunity at previous daily low (120.95)
SP500
SPX H4
SP500 has had a positive week so far with 1.41% up as of Thursday’s market close. It is slowly approaching 4600 level, after forming a double bottom as highlighted by the blue arc. However, the medium-term outlook for stocks markets remains grim as the Fed continues to increase interest rates, which translates to higher borrowing costs for businesses > higher costs to consumers > which leaves consumers with lesser disposable income. They then make lesser purchases which then negatively impact the business’s revenues/ earnings.
USTEC Daily
The technology sector is doing better with a 2.53% gain this week so far with NVIDIA leading at +9.82% followed by Marvell Technology at 6.99%. We may see price retesting 15140 soon, however, upside is still restricted by geopolitical uncertainties and rising rates.
BTCUSD
BTCUSD Daily
Bitcoin is approaching 45000 resistance as we speak. If it breaks through it, we may be looking at 52000. Confluences that added to this slightly bullish sentiment are the higher lows being created, and also Chair Pavel Zavalny said that Bitcoin will be considered as an alternative way to pay for Russia’s energy exports.


