Recap: Jackson Hole Symposium
Attendees of the symposium sent a unanimous message that inflation should be tackled forcefully, especially in the US and the European economies. Tightening policies will be followed even if they cause collateral damage. Fed Chair Powell, among several other Fed officials, stated that they did not expect to change course, necessarily disabusing the rumors of a “Fed Pivot” next year.
With the central bankers being highly hawkish, let’s look at what happened and what is most likely to happen to different currencies and assets this coming week.
Forex
EURUSD

EURUSD H4
Last Friday, EURUSD rallied to a high of 90 pips above parity before reversing its course sharply and closing at 0.9964. This price action seems to be pricing in the hawkish comments from Jackson Hole and the tendency of a further down move is very likely.
0.9900 is the final line of support for the pair and it may spell disaster if it breaks. We may be looking at the psychological levels at 0.9800 and 0.9700 for our next downside targets
Need some trading ideas for EURUSD?
Trading Central Featured Ideas
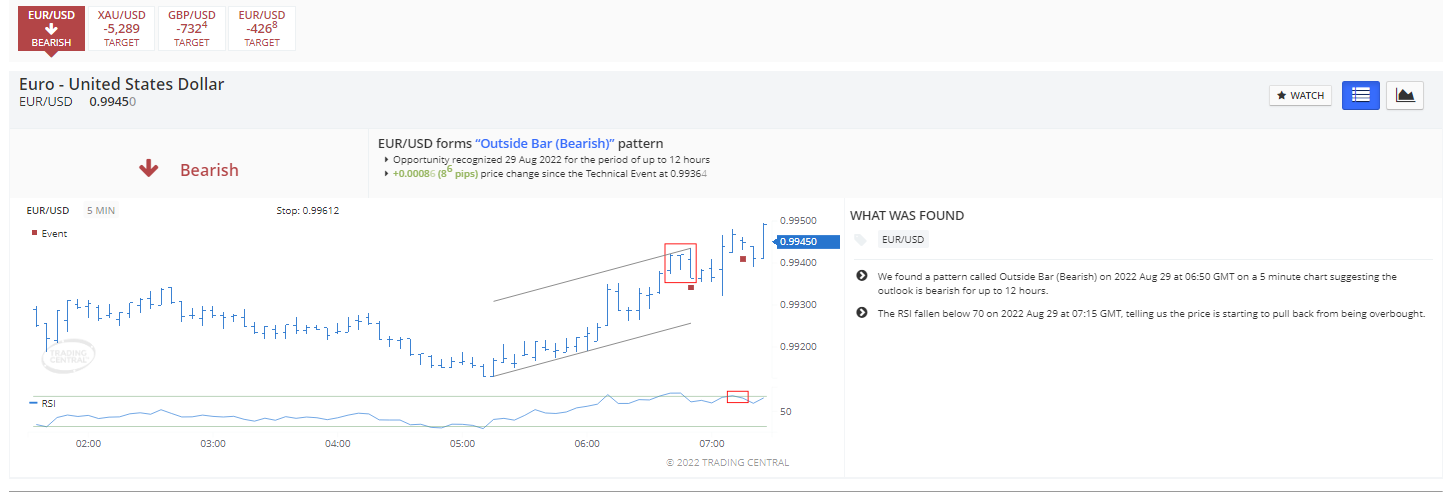
Not long ago, Trading Central’s algorithm spotted an outside bar pattern and is posting a bearish preference for EURUSD. RSI is also employed as an additional confluence to support the outlook.
USDJPY

USDJPY Daily
We are actually pretty concerned about the Yen as it has never been so weak for the past 24 years.
Bank of Japan Governor Haruhiko Kuroda also gave a word at Jackson Hole albeit facing contrasting challenges in their home country. The inflation rate is at 2.4% and may approach 3%, caused almost entirely by the international commodity price hike in food and energy. However, it may decline to 1.5% next year and therefore they will continue with their expansionary monetary policies to meet inflation target.
What does this mean for USDJPY?
Super Hawkish Fed vs Dovish BOJ. The greenback is not going to stop strengthening against the Yen and from the charts we can see that this situation has been going on for quite some time. The pair has been making consistently higher highs and higher lows since its rally started in March this year. With the macroeconomic fundamentals playing in favour of the dollar, USDJPY may soon break its resistance at 139.00 and soar towards the 141.50 area.
Precious Metals
Gold

XAUUSD H4
Gold continued to dip after losing $20.38 last Friday. It is already down $16 since the market opened today and is poised for further losses considering the strong downwards momentum. Bearish sentiment is solidifying following Powell’s speech and Jackson Hole and a stronger dollar outlook.
The buyers should pray that 1680 can hold or else a fall to the $1500 is in the cards. The next key support levels are marked at 1714 and 1680.
Energies
Crude Oil

USOIL H4
USOIL rose 1.47% as of writing on the prospect of a supply cut from OPEC and a growth in demand.
Two bullish factors
- OPEC may reduce output if it is required to support prices
- Rising natural gas prices in the Eurozone
However, USOIL may need a more convincing break above the $94 resistance area for a further up move. Otherwise, a slow U.S. growth outlook may keep oil prices in check.
US Stocks Market
SP500
SP500 Daily
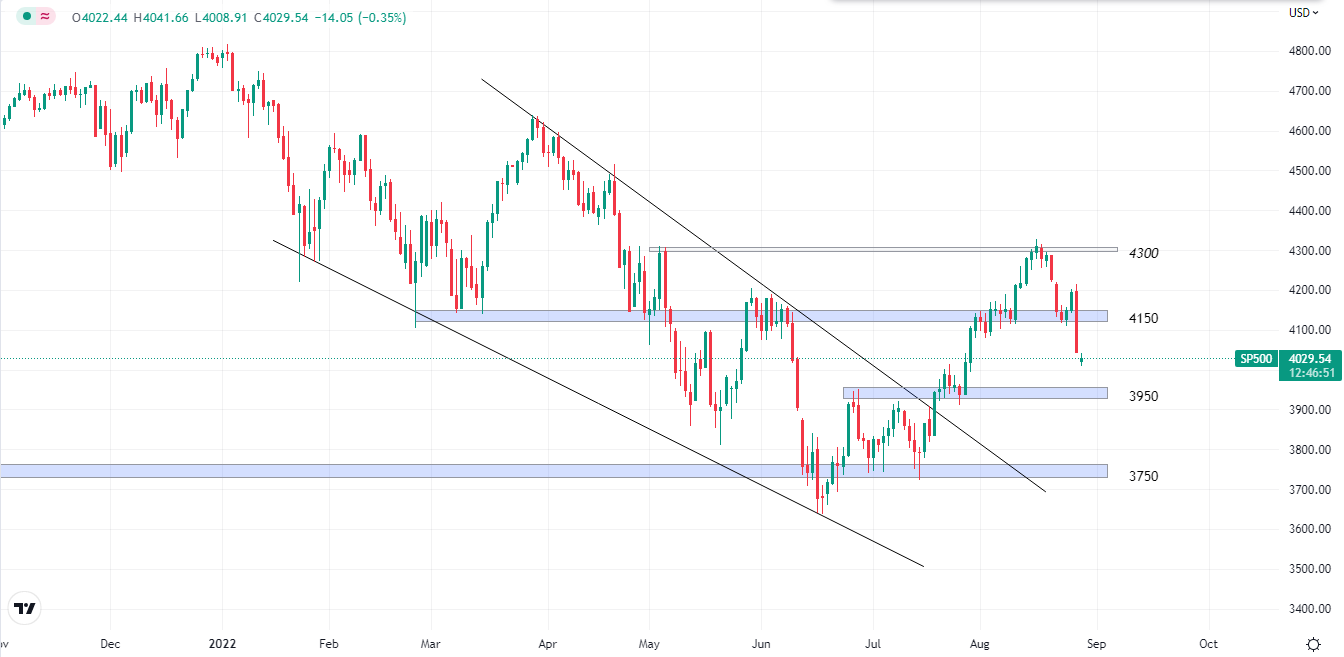
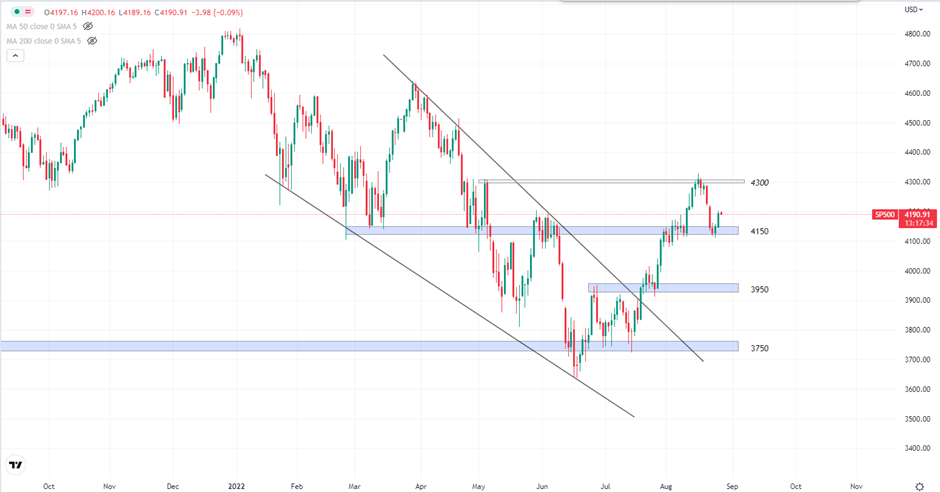
The SP500 lost 3.61% last Friday, forcing the index below 4150 support. As the Fed continues to stay hawkish, the equities market may not have much room to rise in the short term.
Welf
Trader, Technical Analyst
________________________________________________________________________________________
Don’t miss out on BIG market moves!
Want to trade more than 300+ instruments with raw spreads starting from 0 pip and commissions as low as $2 per lot per side?
Sign up with FXPIG now!
Jackson Hole, Powell’s Speech, and PCE Price Index in Focus
PCE Price Index is scheduled to be released 90 minutes prior to Powell’s speech. The index is expected to slow down from 0.6% to 0.3% m/m and from 4.8% to 4.7% y/y. A divergence in the data could cause last-minute edits to his speech which may ignite market volatility. Provided that several Fed members have been hawkish as of late, Powell is expected to follow the majority or at least not be on the other end of the spectrum.
At the time of writing, the probability of a 75bps vs a 50bps rate hike is 62% vs 38%, and therefore, the more dovish Powell is, the more ‘surprised’ the market is going to react.
If there are any changes to the expectation of future rate hikes and their magnitude, we could see weakness in the dollar which may subsequently lead to rallies in stocks and commodities.
It is also important to note that Jackson Hole takes place over 3 days (including the weekend) which may lead to additional volatility or a gap at the open on Monday. This is why we do not suggest holding positions over the weekend, depending on your strategy and risk tolerance.
FX
EURUSD
EURUSD H4
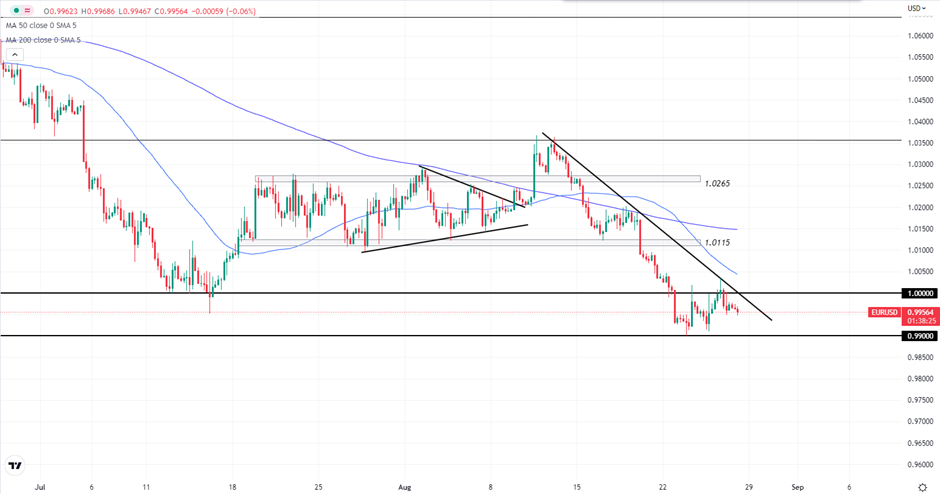
Trading volume has slowed down as the market is waiting anxiously for Powell’s speech, the PCE Price Index, and everything that might be happening at Jackson Hole. Looking at the technicals, the bearish trendline is still intact and prices are still trading below both the 50 and 200-period moving averages.
While the Euro is trying its best to push the price back above 1.0000, USD strength is not diminishing. EURUSD will be the major pair to focus on with it being the most traded FX pair.
A break under 0.99000 could signal further downside and we scrolled back more than 20 years on the chart to find the next support at 0.9620. However, each century mark will be acting as psychological levels such as 0.9800 and 0.9700.
Precious Metal
Gold
XAUUSD H4
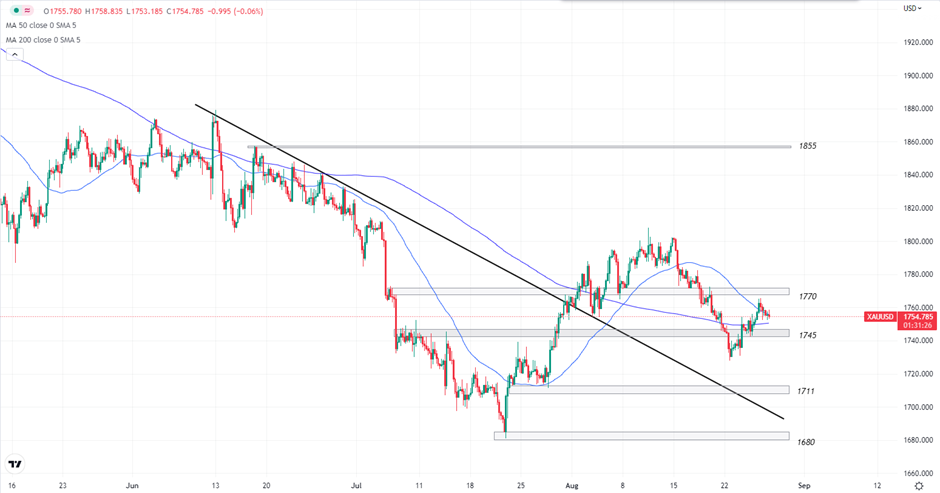
Trading activity on gold can be seen softening as well ahead of Powell’s speech and Jackson Hole. It is one of the instruments that reacts violently to macroeconomic developments and consolidation is signaling an impending breakout.
The yellow metal is only up + 0.36% or $6.58 for this entire week which shows indecision among market participants. Personally, I would only look for opportunities near key levels such as 1711 and 1800 to avoid getting trapped by random price spikes.
A break below 1711 could resume gold’s bearish trajectory while a break upwards of 1800 could push gold’s prices higher.
US Stocks Market
SP500
SP500 Daily
SP500 gapped down to start the week and proceeded lower to test 4150. Demand kicked in to drive the index back to near weekly’s open, suggesting uncertainty and indecision. If the PCE price index comes out higher than expected, Fed may remain highly hawkish which will cap further up move on equities.
Energies
Crude Oil
USOIL H4
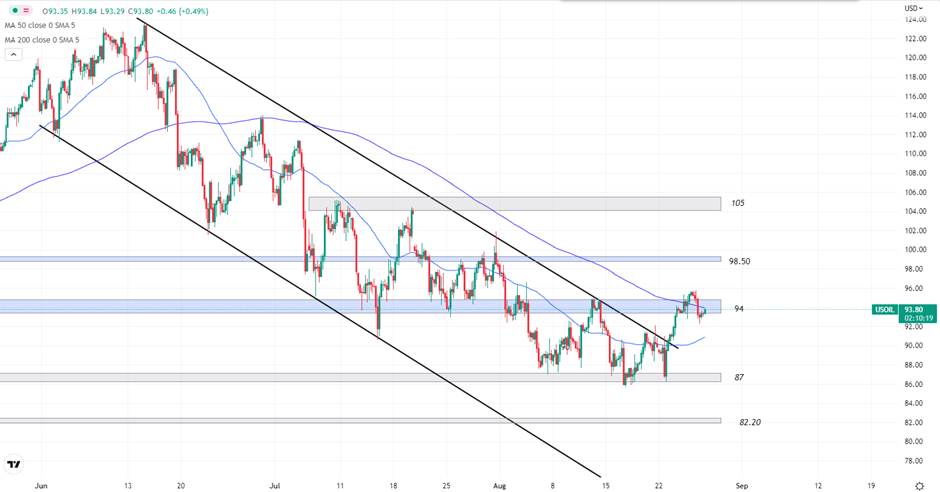
USOIL broke out from its bearish channel earlier this week following the news that OPEC+ may be inclined towards cutting their production if Iran nuclear deal revives and their oil production returns.
Crude oil slipped lower in the previous US session but has recovered some ground during Asia. The mood remains cautious as investors are sitting on the sidelines for further clues from the upcoming events (Jackson Hole and Powell’s speech).
200 period moving average is offering some resistance at the current price near $94 bbl. Future oil prices remain highly dependent on upcoming economic data from China and other key economies but the recent breakout tilts the odds to the upside.
Welf
Trader, Technical Analyst
________________________________________________________________________________________
Don’t miss out on BIG market moves!
Want to trade more than 300+ instruments with raw spreads starting from 0 pip and commissions as low as $2 per lot per side?
Sign up with FXPIG now!
Hi All,
Tesla will be performing a 3:1 split after the close on August 24th, 2022. As a result, we will be adjusting the open prices/volumes of all open tickets to account for the 3:1 split after the stock market close.
Example: Old Ticket: Client Buys 100 Shares Tesla @ $900
New Ticket: Client Buys 300 Shares Tesla @ $300
Please let us know if there are any questions.
FXPIG Team
Week in Review
England’s CPI
CPI in Britain came out hotter than expected, printing 10.1% YoY versus 9.8% as forecasted by economists. This is especially concerning as it is the first time in four decades that the inflation rate surges past 10 % with some expecting the figure to peak above 15% by early next year.
BOE raised its interest rates by 50bps earlier this month, its biggest rate hike since 1995, and is expected to maintain its hawkish stance to contain its spiraling inflation. Investors also priced in the interest rate to be as high as 3.75% by around March next year.
Let’s review the price action on GBPUSD
GBPUSD (Bearish)

GBPUSD H4
After forming a double top pattern with equal highs at 1.2285, the neckline was subsequently broken with ease during the last New York session. The support at 1.1925 is barely holding on as the sellers are attempting to push the price further downwards.
This shows that the greenback is still having way more strength than the Pound does, even after such as bad CPI figure while US’s inflation on the other hand is seemingly cooling down according to its last CPI data.
| Technical Levels | Price Zone |
| R2 | 1.2285 |
| R1 | 1.2050 |
| S1 | 1.1925 |
| S2 | 1.1760 |
FOMC Minutes
The Fed did not drop hints on the pace of interest rate hikes but has begun to recognize that they might have gone too far in curbing economic activity. However, the minutes also stated that there was little evidence to show inflation was slowing down despite a better-than-expected CPI print for July which caused a portion of investors to gravitate back to an expectation of 75bps in the next FOMC Meeting.
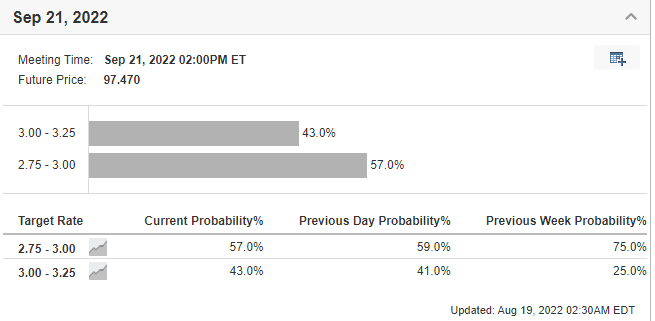
Source: Investing.com
The probability of a 75bps rate hike to a target rate of 3.00-3.25 has increased from 25% in the past week to 43%.
What does this mean for the Dollar?
EURUSD (Bearish)

EURUSD H4
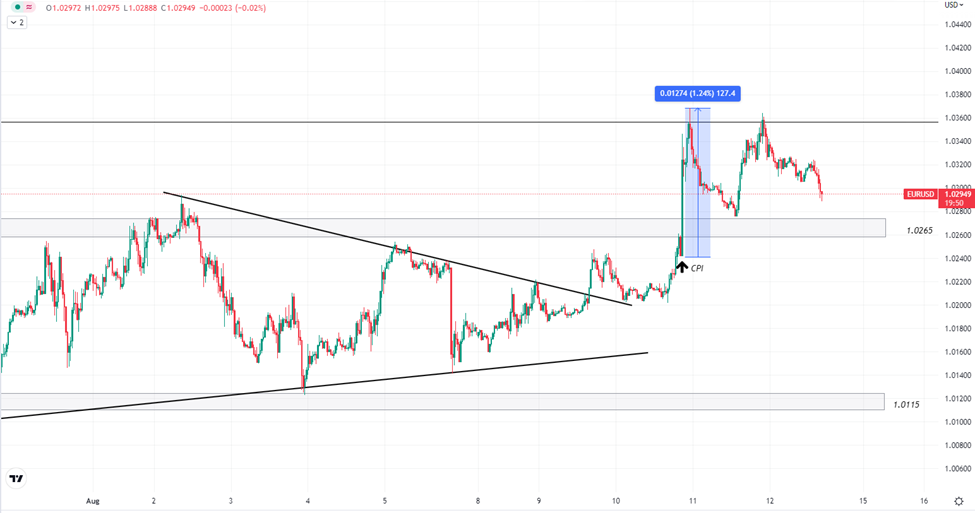
The Fibre was consolidating peacefully in the range between 1.0265 and 1.0115 before the Phily Fed Manufacturing Index was released. This event usually does not cause much volatility but the print yesterday tops estimates and was more than just good. The data come out at 6.2 compared to a forecast of -4.9 and the previous print of -12.3. The index surveys manufacturers in Philadelphia to gauge the general business conditions and the recent data shows that the industry is showing significant growth and improvements which gave a huge boost to the Dollar.
EURUSD plunged by almost 100 pips following the event and is now trading below 1.01165 support. It seems likely that the pair can continue this bearish move and test parity again as the USD continues to uphold its strength across the board.
| Technical Levels | Price Zone |
| R2 | 1.0265 |
| R1 | 1.0115 |
| S1 | 1.0000 |
| S2 | 0.9900 |
Energies
USOIL (Bearish)

USOIL H4
Crude oil dipped after two winning days as the Asia session began. While strong US manufacturing data reinforced optimism for improved fuel demand in the short term, a likely increase in output by OPEC+ and persistent worries about economic slowdown are capping the upside.
Technical-wise, we have readjusted our trendline to accommodate the latest price action. Currently, the price is well-contained within the bearish channel with a higher chance of it staying inside instead of a bullish breakout.
| Technical Levels | Price Zone |
| R2 | 98.50 |
| R1 | 94.00 |
| S1 | 87.00 |
| S2 | 82.20 |
Cryptocurrencies
Bitcoin (Bearish)

BTCUSD H4
Bitcoin did not have the chance to test the 25500 resistance area before it declined. After breaking out of the rising wedge, the coin saw an increase in bearish momentum which signifies sellers being in control. The sentiment continues to be tilted towards the downside as we see Bitcoin plummet as much as 6.15% in the past hour before a minor recovery took place.
If the bearish impulsive move extends, we could see the previous swing low at 20800 being tested shortly.
| Technical Levels | Price Zone |
| R2 | 23600 |
| R1 | 22400 |
| S1 | 20800 |
| S2 | 18900 |
Welf
Trader, Technical Analyst
________________________________________________________________________________________
Don’t miss out on BIG market moves!
Want to trade more than 300+ instruments with raw spreads starting from 0 pip and commissions as low as $2 per lot per side?
Sign up with FXPIG now!
Economic Calendar
| Day | Events |
| Monday | French, Italian Bank Holiday |
| Tuesday | AUD Monetary Policy Meeting Minutes |
| Wednesday | NZD Cash Rate and Monetary Policy Meeting Minutes, GBP CPI, USD Retail sales |
| Thursday | FOMC Meeting Minutes |
| Friday | – |
Last week we observe more actions and higher volatility in the markets due to the softer-than-expected US CPI data. Does that mean that inflation has peaked? How will it affect Fed’s monetary policies moving forward? We are eager to find out and only time will tell. In this coming week, we will be focusing on minutes of past central bank meetings including the FOMC and RBA, coupled with the NZD cash rate and the UK’s CPI number.
USD Outlook

Source: Investing.com
The chart above shows the market’s expectations for future rate hikes. The probability of a 50bps rate hike jumped from 42% last week to 69% this week. This indicates that the market is expecting the Fed to raise rates lower than the previously expected 75bps, which made the greenback plummet briefly last week.
Forex
EURUSD

EURUSD Daily
USD weakens against most pairs following CPI announcements last week but it managed to recover swiftly. Based on the chart above, the dollar has recouped all losses against the Euro and is trading at a similar level pre-CPI.
It seems a breakout to the upside for EURUSD is unlikely with the USD being in control and price closed firmly below 1.0265 support.
| Technical Levels | Price Zone |
| R2 | 1.0360 |
| R1 | 1.0265 |
| S1 | 1.0115 |
| S2 | 1.0000 |
Precious Metals
Gold

XAUUSD Daily
Gold sank as the market opened this morning, signaling a stronger dollar. It is now sitting on major support in the 1785 area and it will be key to see if it is able to bounce back.
If it breaks lower, then gold will be making a lower leg and breaking its previous swing low. That could set a bearish tone for the rest of the week.
| Technical Levels | Price Zone |
| R2 | 1808 |
| R1 | 1785 |
| S1 | 1770 |
| S2 | 1755 |
Energies
USOIL

USOIL H4
Oil price continued to trade lower as the market opened and it has shed more than 4.5% from its previous high. The slump could very well be due to weaker than expected economic growth in China while Saudi Aramco said it was ready to increase its production.
On the charts, the oil price is coming back down to retest the broken bearish channel with a low probability of it bouncing. If it trades lower we are looking at $87 for the next support level and for the price to continue trading within the channel until significant optimistic news comes out for the oil market.
| Technical Levels | Price Zone |
| R2 | 98.50 |
| R1 | 94 |
| S1 | 87 |
| S2 | 82.50 |
Welf
Trader, Technical Analyst
________________________________________________________________________________________
Don’t miss out on BIG market moves!
Want to trade more than 300+ instruments with raw spreads starting from 0 pip and commissions as low as $2 per lot per side?
Sign up with FXPIG now!
Let’s focus on the key highlight for this past week- the US CPI and its impact on different asset classes
CPI data which came out on Wednesday delivered a positive surprise where the print was lower than forecast by 0.2%, standing at 8.5% for July YoY. Core CPI, excluding food and energy, was the same as the prior month at 5.9%, but lower than the 6.1% anticipated. Inflationary pressures started to ease, but is it sufficient for the Fed to alter its hawkish stances?
How did the market react?
Forex
EURUSD
EURUSD M30
The fiber broke out from its triangle formation before jumping as much as 127 pips after the CPI data. USD weakens across the currencies board as we see a similar reaction on GBPUSD, AUDUSD and USDJPY just to name a few. However, 1.0360 seems to be a tough resistance as the pair made equal highs here.
Precious metals
Gold

XAUUSD M30
Gold prices jumped by 1% or approximately $17 in the 30 minutes following the CPI announcement. However, bullish momentum subsided rapidly which led to a formation of a triangle pattern The yellow metal failed to build up a rally like most other metals do. We also observed a risk-on market post CPI across equities for instance…
US Stocks Market
Nasdaq 100

USTEC H4
The Nasdaq Composite posted gains of as much as 3.68 % in the next 24 hours following the CPI release as investors buy into risk assets, before undergoing a minor retracement. We can also observe bullish momentum is picking up steam as the slope of the upward trendline is getting steeper and thus the probability of a break above 13550 has increased significantly. Are we going to see the break later during the trading session or do we need to wait till next week?
What about the energy markets?
Energies
USOIL

USOIL H4
Oil prices climbed and look set to end the week in gains while recouping more than half of the previous week’s losses. IEA bumped their outlook for global oil demand to 2.1 million bpd due to power generation switching from natural gas to oil, caused by rising gas prices. On the contrary, OPEC reduced its forecast for growth in global oil demand yesterday by 260k BPD this year, which may in turn cap further price rise.
From a technical standpoint, USOIL broke out from our bearish channel and is flirting with $94 resistance as we speak. If the breakout is successful, we may be looking at $98.50 or even back to triple-digit oil prices.
Cryptocurrencies
Bitcoin

BTCUSD M30
The leader of cryptocurrencies also benefited from CPI’s pleasant surprise where it posted a gain of 4.73% in the hour following the release. The buyers then manage to maintain their strength which pushed the price further to a higher near $25000 before a healthy correction takes place.
And if we zoom out and take a look at the bigger picture…

BTCUSD H4
Bitcoin is forming a rising wedge pattern while trading above the 50 and 200 period moving average, looking ready to trade higher. $25500 (that is from a previous swing low) will be acting as the immediate resistance for the buyers. There could be a potential opportunity to go long should the price retraces to the lower end of the rising wedge, or even as low as the $22400 support area.
Welf
Trader, Technical Analyst
________________________________________________________________________________________
Don’t miss out on BIG market moves!
Want to trade more than 300+ instruments with raw spreads starting from 0 pip and commissions as low as $2 per lot per side?
Sign up with FXPIG now!
Economic calendar
| Day | Events |
| Monday | – |
| Tuesday | – |
| Wednesday | Core CPI |
| Thursday | JPY Bank Holiday |
| Friday | GBP GDP m/m |
*Important events only
It is a light week in the market with only a few key events to watch out for including the CPI numbers and the UK’s GDP. NFP came out with a huge positive surprise, printing 528k new jobs in July which is more than double the expected figure. It is signalling a super solid labour market, which may prompt the Fed to make a more aggressive rate hike in the next meeting. CPI data on Wednesday is going to be equally, if not more important than the job’s numbers.
Let’s look at what happened to…
Precious Metal
Gold
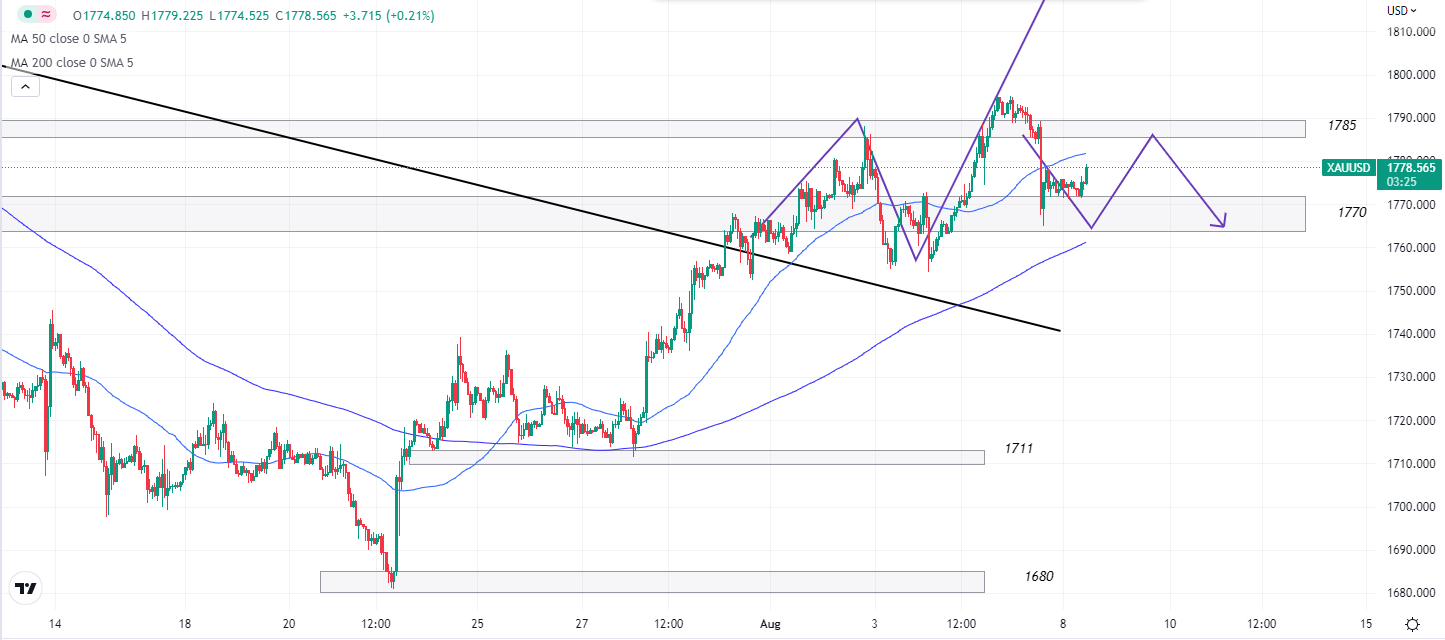
XAUUSD H1 Chart
With a better-than-expected job number, the greenback got stronger which caused a shift drop in gold prices. Gold fell from $1788 to $1769 in the 30 minutes following the announcement which trailed our scenario 2.
As it is now trading in a range between $1770 and $1785, we are waiting for a breakout on either side. Higher lows on the hourly chart make it seems like an upward trend is more likely. CPI is going to be the main mover for gold this week.
| Technical Levels | Price Zone |
| R1 | 1785 |
| S1 | 1770 |
Forex
EURUSD
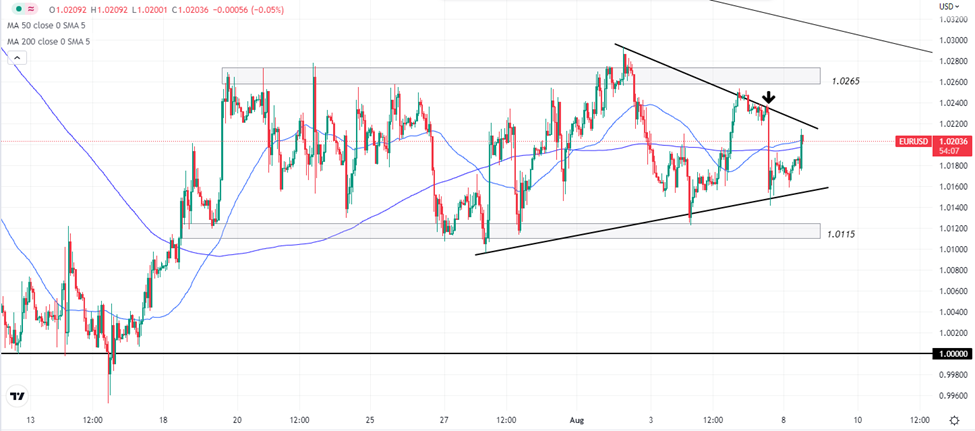
EURUSD H1 Chart
The fiber is in a fresh triangle formation now, with NFP pushing the pair from the upper trendline to the lower trendline as marked by the arrow. As the trading range gets narrower, it may be signaling that EURUSD is on the verge of an impulsive breakout. CPI incoming.
There is currently no directional bias, with both moving averages tangled together.
| Technical Levels | Price Zone |
| R1 | 1.0265 |
| S1 | 1.0115 |
TSLA
Tesla held its annual meeting last Thursday, and here are the key highlights
- Shareholders agreed to the proposed 3 for 1 stock split
- Tesla’s Full Self Driving has a new update available for beta testing
- 2- million units of production is the aim that Tesla wants to achieve by end of the year
- A new gigafactory will be announced before the year ends. Longer term goal is to have 10-12 gigafactories
- Cybertruck to begin production in 2023, though the price and specifications are going to differ from its initial announcement
- Elon Musk envisions Tesla to be the most valuable company in the world when self-driving robotaxis and Optimus Humanoid Robot are being rolled out

TSLA Daily Chart
Following the annual meeting, TSLA shares declined on Friday trading by 6.63% despite all the positive announcements made in terms of new products, vision and future outlook, and not to forget the agreed stock split which is going to take effect on August 25.
The 200-day moving average along with the $950 proved to be tough resistance for the bulls. The next support is at $770.
CTA
Trader, Technical Analyst
________________________________________________________________________________________
Don’t miss out on BIG market moves!
Want to trade more than 300+ instruments with raw spreads starting from 0 pip and commissions as low as $2 per lot per side?
Sign up with FXPIG now!
Economic calendar -Week 31
| Day | Events |
| Monday | Australia, Switzerland, Canada Bank Holiday; US ISM Manufacturing PMI |
| Tuesday | AUD Interest Rates |
| Wednesday | US ISM Services PMI, OPEC+ |
| Thursday | GBP Monetary Policy Report, GBP Rate Statement |
| Friday | RBA Monetary Policy Statement, NFP |
*Only key events are listed
As the Fed raised their interest rates last week, it’s the turn for RBA (Australia) and BOE (UK) this week, with both of them expected to hike their interest rates by 50bps. NFP is also out on Friday and the numbers will be crucial as the Fed has been using the strong job numbers as one of the factors to back their interest rate hike. A weaker job number may deter the Fed from raising rates as aggressively in their September meeting. As for the energy sector, OPEC+ is going to hold a meeting on the 3rd of August, and investors should pay attention to their production plan and their outlook on the energy market, crude oil in particular.
Interest Rates Frenzy
A 50bps rate hike is expected from RBA on Tuesday to bring the cash rate to 1.85% with the main reason for cooling inflation. The inflation printed 6.1% YoY in Q2, which was lower than the expected 6.2%, which subsequently reduced the possibility of a 75 bps hike.
AUDUSD

AUDUSD Daily Chart
AUDUSD has been edging higher for 2 weeks from its previous swing low at 0.6700. Currently testing 0.7060 resistance and the upper boundary of the channel, the chance of a breakout is fairly low as the market has most likely priced in a 50bps hike by the RBA later this week. However, a breakout might be imminent if RBA makes a surprise move to raise rates by more than the general forecast.
| Technical Levels | Price Zone |
| R2 | 0.7270 |
| R1 | 0.7060 |
| S1 | 0.6840 |
| S2 | 0.6700 |
GBPUSD
The BOE is expected to increase its interest rates to 1.75% (a 50bps hike) at its Thursday meeting. Inflation is way worse at 9.4% YoY in June compared to Australia’s. Referring back to what was been mentioned in the last meeting, it was stated that a more forceful action might be taken if it is necessary to keep inflation in check. Will the BOE announce a 75bps hike? A full point hike?

GBPUSD H4 Chart
The Cable has been trailing the path of our scenario 1 decently. It broke out from its bearish trendline, made a retest, picked up steam, and bounced away from the support. It was a very textbook trade.
However, the pressing question now is whether the Pound can sustain its bullish momentum until the interest rate announcement on Thursday. Some supporting confluences for the bulls include the position of the Moving averages with a cross-over in sight. Also, the pair has been making higher lows as it moved away from the support at 1.1925.
1.2400 will be a key resistance area to determine if the pair can move into bullish territory.
| Technical Levels | Price Zone |
| R2 | 1.2659 |
| R1 | 1.2400 |
| S1 | 1.1925 |
| S2 | 1.1760 |
Energies
WTI Crude

USOIL Daily Chart
US Crude breached the $100 mark briefly on Friday but the buyers couldn’t hold the price above that level and we observed a very clean wick above the $98.50 resistance level. To start the week, Oil traded lower during the Asia session, -0.8% at the time of writing. Trading volume may be lower today, affected by Canadian Bank Holiday and also the upcoming OPEC+ Meeting on Wednesday. We have discussed this before but I will mention it again, the President of the United States has recently visited Saudi Arabia to talk about oil production among other topics, and it could ease the strain on the oil supply and prevent oil prices from rallying too high in the short term.
| Technical Levels | Price Zone |
| R2 | 105.00 |
| R1 | 98.50 |
| S1 | 94.00 |
| S2 | 90.00 |
Precious Metals
Gold
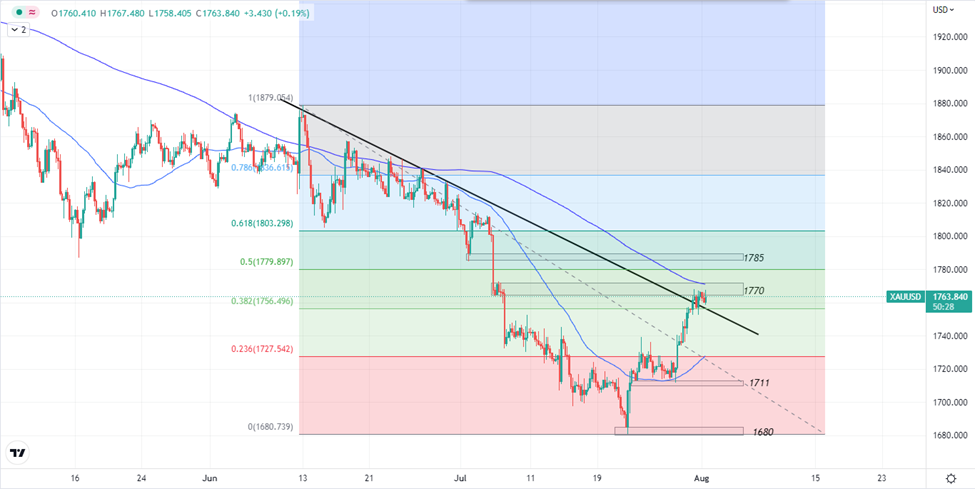
XAUUSD H4 Chart
Gold steadies above $1750 and the .382 Fibonacci level after its rally from the FOMC announcement. Momentum is pausing briefly as it breaks through the trendline and tests the 1770 resistance. The 200-period moving average is also in the way of the buyers. Investors may be waiting on the sideline for the PMIs on Monday and Wednesday. But more importantly, we should eye for the NFP this Friday as the consensus is significantly lower than the previous month’s data. NFP is one of the biggest catalysts for gold prices.
| Technical Levels | Price Zone |
| R2 | 1785 |
| R1 | 1770 |
| S1 | 1711 |
| S2 | 1680 |
US Stocks Market
Nasdaq 100
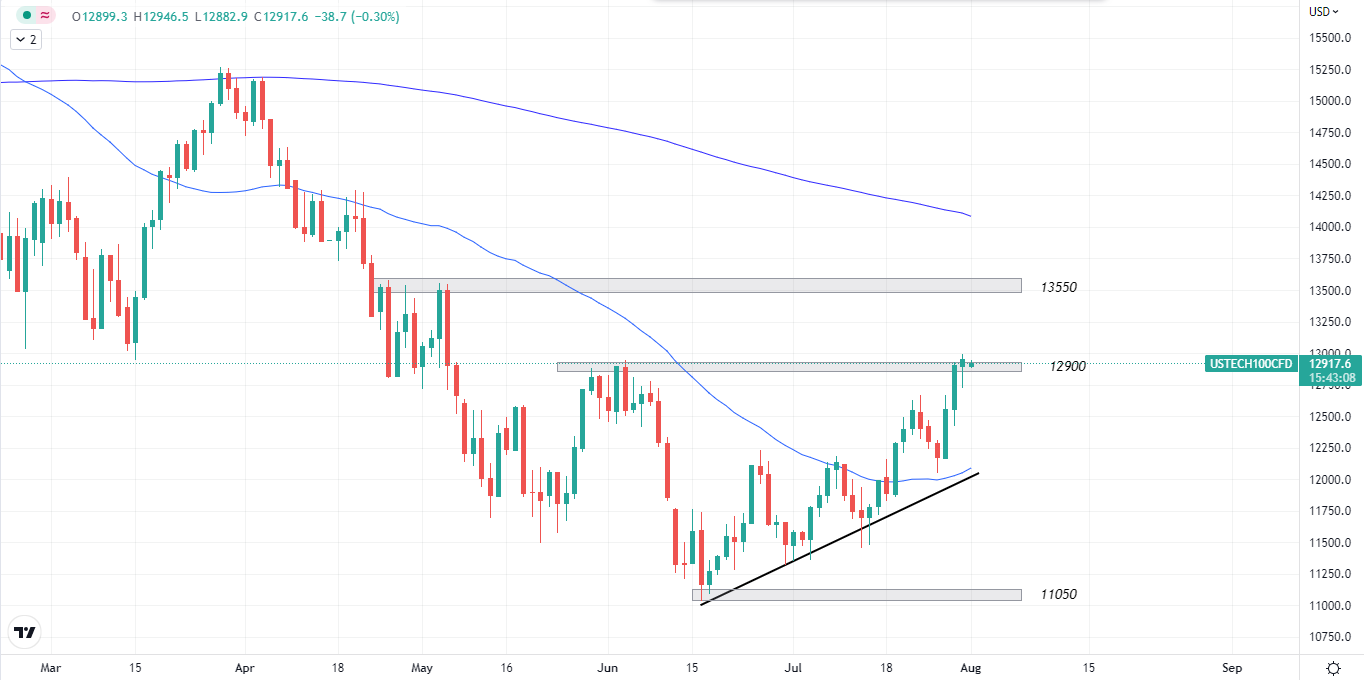
USTEC Daily Chart
Earnings season is coming through with most companies posting better than expected gains in Q2 including AAPL, GOOG, and AMZN which sent USTEC higher. Currently faced with 12900 resistance, it is very likely for it to break through it, considering the strong bullish candles for last week. The next level that we aim for is 13550. The downside is firmly supported by the bullish trendline and the 50-day moving average.
| Technical Levels | Price Zone |
| R2 | 1820 |
| R1 | 1810 |
| S1 | 1790 |
| S2 | 1770 |
Welf
Trader, Technical Analyst
________________________________________________________________________________________
Don’t miss out on BIG market moves!
Want to trade more than 300+ instruments with raw spreads starting from 0 pip and commissions as low as $2 per lot per side?
Sign up with FXPIG now!
Economic Calendar
| Day | Events |
| Monday | – |
| Tuesday | – |
| Wednesday | AUD CPI, FOMC statement |
| Thursday | Advance GDP- USD |
| Friday | Core PCE Price Index |
FOMC statement will be the key highlight for this coming week as investors are waiting for the impending rate hike from the Fed. We are going to discuss USD related pairs in this week ahead analysis to prepare you for the event.
Precious Metals
Gold

Gold Daily Chart
The yellow metal has had a decent recovery towards the end of last week as we see a near $60 bounce from the key support of $1680, which shows that the demand is still strong at that level.
Currently, it is trading above $1722 minor resistance and it seems like the recovery may continue for a little while, with the next target at $1760. If the Fed do not make any surprise move this Wednesday we may see gold following through on its bearish momentum and test $1680 again.
| Technical Levels | Price Zone |
| R2 | 1785 |
| R1 | 1760 |
| S1 | 1722 |
| S2 | 1680 |
Forex
EURUSD

EURUSD Daily Chart
EURUSD has been stuck in the 1.0150- 1.0250 range for a couple of days now. Investors are indecisive on where the pair should go amid Fed policy statement. We have mapped out two scenarios on where the price can potentially move, but the probability of a down move is greater provided that the pair is currently in a downtrend.
1.0350 is our primary target in the short term, but the larger picture may still be highly dependent on the FOMC meeting in two days.
| Technical Levels | Price Zone |
| R2 | 1.0650 |
| R1 | 1.0350 |
| S1 | 1.0000 |
| S2 | 0.9900 |
Energies
Crude oil

USOIL H4 Chart
Apparently, US crude did a fake out to our scenario one and instead followed the trajectory of scenario 2.
It extended its losses as investors are worried that an increase in interest rates by the Fed may negatively impact oil demand by restricting economic activities. Some other bearish fundamental developments include a tweak in Russian sanctions that allows them to trade with third countries and Libya scheduled to increase oil production to 1.2M bpd in the next two weeks.
US oil is trading on the support at $94 but the level seems brittle. $90 will be the next target level to look for a potential bounce and recovery.
| Technical Levels | Price Zone |
| R2 | 100.00 |
| R1 | 98.50 |
| S1 | 94.00 |
| S2 | 90.00 |
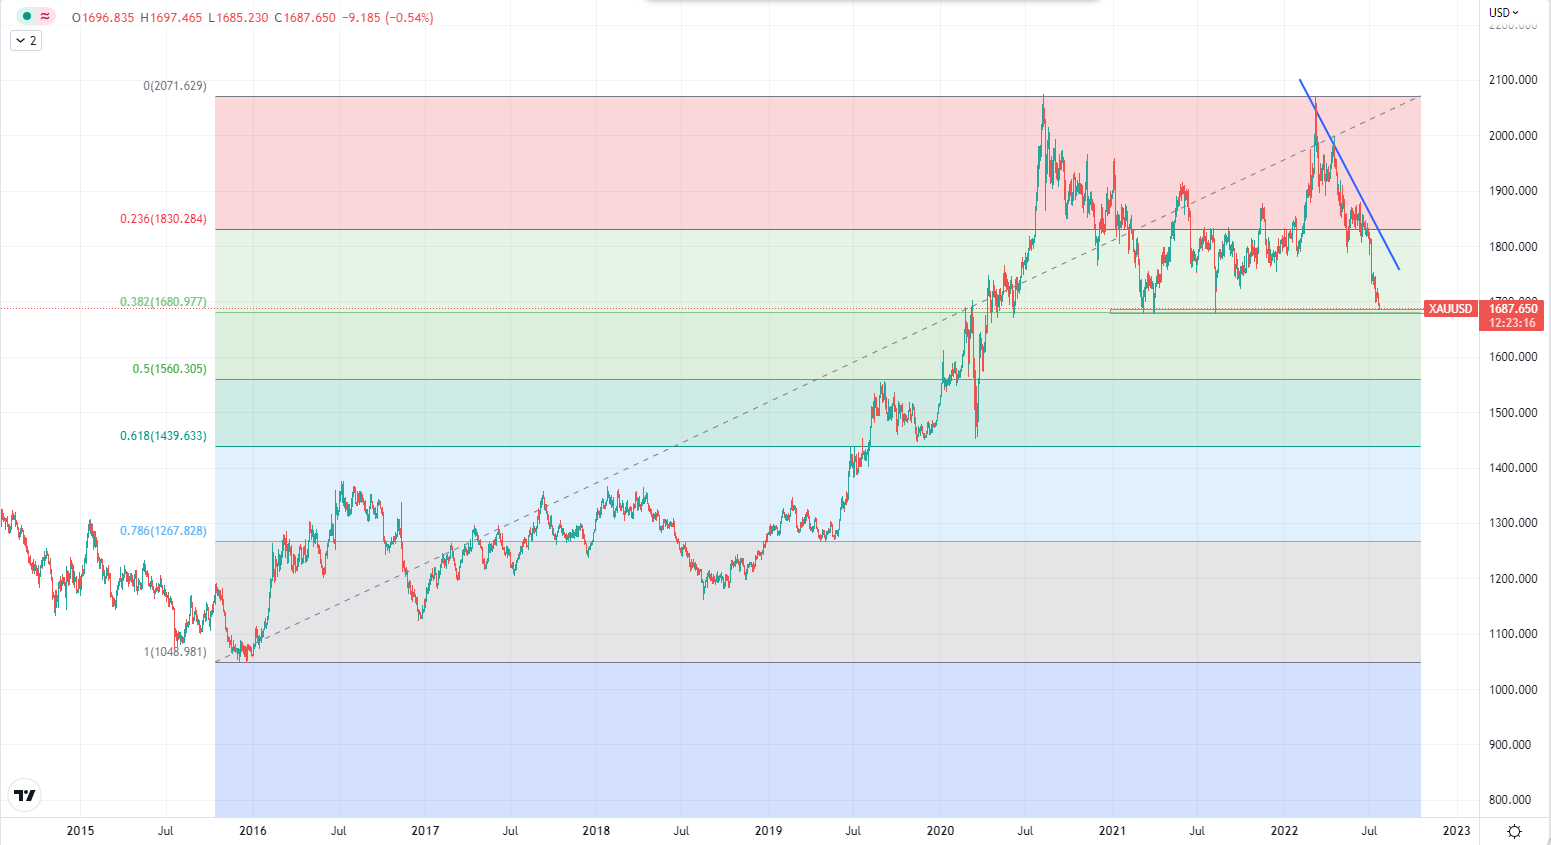
XAUUSD research
Looking at a daily chart, we are still seeing gold showing extreme weakness due to rising inflation, a strong USD, and a hawkish Fed that is still poised to raise interest rates further this year. From a technical perspective, XAUUSD is poised to test the 38.2% Fibonacci retracement of 1680.58 which could hold as strong support as gold has not broken below this level over the past 2 years plus. With that being said, there are still many hurdles for XAUUSD as the pair did have a death cross early this month where the 50-period moving average broke below the 200-period moving average.


