Economic Calendar
| Day | Events |
| Monday | JPY Bank Holiday |
| Tuesday | AUD Monetary Policy Meeting, BOE Bailey and RBA Lowe speaks |
| Wednesday | GBP CPI |
| Thursday | BOJ Outlook Report, EUR Main refinancing rate, ECB Press conference |
| Friday | – |
GBPUSD
GBPUSD Daily
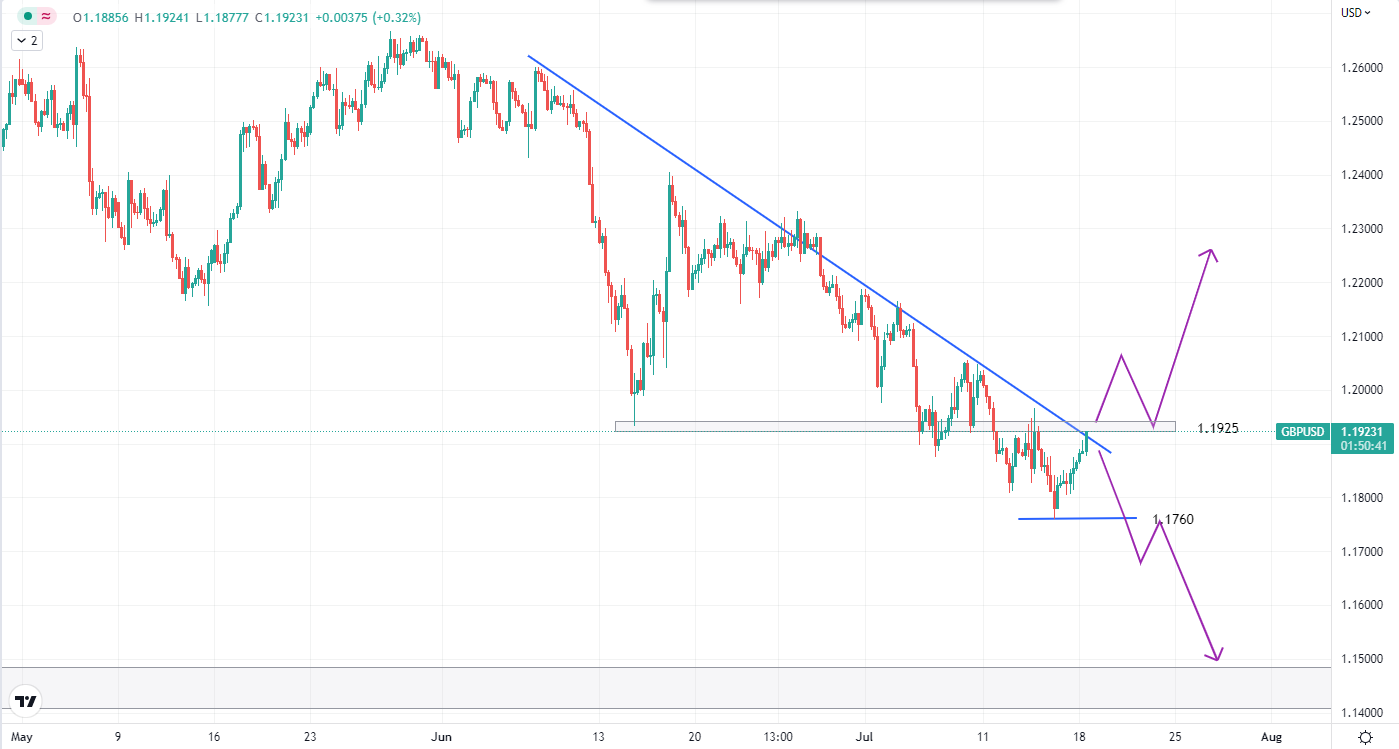
BOE’s current main goal is to fight inflation and governor Bailey’s speech may drop some hints about the next monetary policy moves.
GBP is doing great with GBPUSD rose by more than 56 pips since the market opened this morning. It is now testing 1.1925 resistance which coincides with the bearish trendline. We are waiting to see if the price can break and close successfully above this level.
First scenario: If it breaks, we will have a buy opportunity when price retest the resistance-turned-support at 1.1925.
Second scenario: If the trendline and resistance level remain intact, price may fall to 1.1760 previous swing low. If that breaks too, we are looking at a downside continuation towards 1.1500 daily timeframe key support.
| Technical Levels | Price Zone |
| R2 | 1.2000 |
| R1 | 1.1925 |
| S1 | 1.1760 |
| S2 | 1.1500 |
EURUSD

EURUSD Daily Chart
At the time of writing, EURUSD has bounced 140 pips away from parity which shows some demand at 1.0000. The question is whether this up move is a knee-jerk reaction (minor retracement), or is it a long term reversal in the making.
The next level of interest is 1.0350 (if the price goes there) as this is where the trendline and the horizontal resistance level will most likely meet.
First scenario: A reversal takes place in the market and EURUSD broke above the trendline, we are targeting 1.0650 although this may not happen so soon
Second scenario: Bearish momentum continues and EURUSD test parity again. If it does happen, our view is that the sellers are much stronger and may be able to push prices further below, targeting 0.9900.
| Technical Levels | Price Zone |
| R2 | 1.0650 |
| R1 | 1.0350 |
| S1 | 1.0000 |
| S2 | 0.9900 |
Precious Metals
XAUUSD

XAUUSD H4 Chart
Gold might be calmer this week as there are no major events that are gold/ USD related. It is approaching the upper trendline and we are waiting for reactions.
Scenario 1: Trendline is broken and gold tests 1745. Depending on market expectations, it could then break higher above 1745 or retrace back down.
Scenario 2: Trendline remains intact and gold proceeds to glide lower until 1700 support and possibly testing 1680.
US Stocks Market
SP500

SP500 Daily
The S&P500 had a not-so-bad week last week after a decent recovery on Friday. The outlook for the stock markets is still highly dependent on interest rates expectations and recessionary concerns.
From a technical standpoint, SP500 is trading just under the bearish trendline.
Scenario 1: SP500 breaks through the trendline and head towards 4150
Scenario 2: The trendline is respected and the index continues to trade lower, testing first support at 3750.
| Technical Levels | Price Zone |
| R2 | 4150 |
| R1 | 3950 |
| S1 | 3750 |
| S2 | 3600 |
Energies
USOIL

USOIL H4 Chart
WTI crude has had a decent recovery since Thursday last week, trading back at triple digits.
This could be due to a softer USD as we saw on EURUSD and GBPUSD also. Let’s see if the concern of tight supplies will outweigh fear of recession in the coming days.
| Technical Levels | Price Zone |
| R2 | 105 |
| R1 | 102 |
| S1 | 94 |
| S2 | 90 |
Economic Calendar
| Day | Events |
| Friday | Retail sales – 8.30 am EST |
Here are some of the key highlights for this week
Twitter and Musk
Surprise? To be honest, not so much. Elon Musk just a few days ago decided to pull out and terminate his deal to buy Twitter which led to him being sued by the company in question. You might be curious on why he decided to walk away from the deal. Musk claimed in a filing to SEC that the social media company failed to meet its contractual obligations and did not provide information requested by Musk earlier in regards to fake and spam accounts.
What is Twitter doing?
Obviously they are suing Musk in the court. Twitter board Chair Bret Taylor also tweeted that they are still committed to ensure that the transaction goes through based on the terms and price agreed upon and legal actions will be pursued in order to enforce the deal.
The deadline of the deal falls on 24th of October and the parties will have another half a year to close it should the transaction still pending approval from regulatory bodies at that time.
Impact on twitter
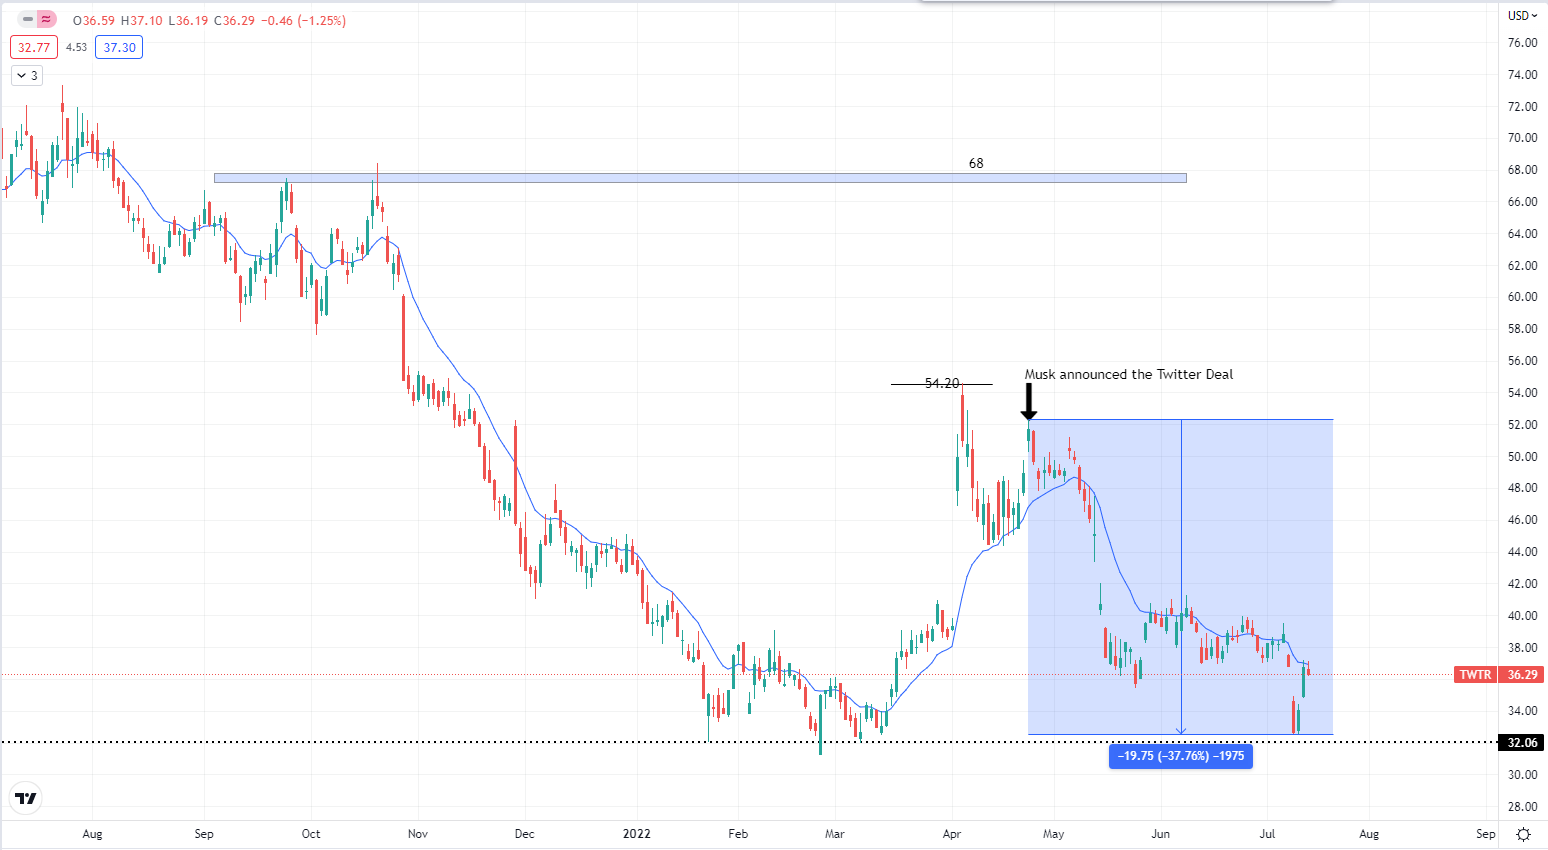
There is a theory that Musk decided to walk away because of poor stock’s performance since his official announcement to purchase Twitter
TWTR Daily Chart
The shares have seen a loss of almost 40% of its value since the deal was first made public. Although Musk said the purchase of Twitter was not for financial gains, it is billions of dollars at stake. What would you do?
We have seen some recovery after the price bounced from $32 support level but is still trading below the 14 EMA. The future outlook for Twitter will be highly dependent on the progress in the court. But I supposed there will be no winner from this except the short sellers.
Tug of War between EUR and USD – Parity
EURUSD H4 Chart
The dollar with its humongous strength pushed EURUSD down to a low of 0.9952 during yesterday’s trading session.The Euro was able to fight to ensure the pair closed above 1.0000 and the pair is still flirting with the parity level. I wouldn’t be surprised if there is a huge move to either side to end the week as this is the most widely traded pair and it is at a pivotal level that hasn’t been seen in 2 decades.
Our outlook remains tilted to the downside until the market structure and chart patterns suggest otherwise. If 1.0000 fail to hold, 0.99 will be the next psychological level to refer to. The 50 day moving average will be the dynamic resistance capping the pair.
Energy Crisis or not?

USOIL / WTI H4 Chart
If we are just analyzing from a technical point of view, the prices were forming lower highs and lower lows. These are textbook formations with a high chance of price following through. In terms of momentum, it is apparent that the bears are way stronger just by looking at the relative size of the candles and speed of the price swings.
Yesterday, WTI oil broke below $94 key support which we have paid attention to for quite some time, although it managed to end the session above the level . The low for yesterday, $90.54 was the price for crude before the Russian-Ukraine war. What does this tell us?
It is most likely conveying that tight supply concerns are not solid enough to support oil prices. On the other hand, recessionary concerns amidst record inflation level and fast-rising global interest rate is putting a gigantic amount of pressure on oil.
If $94 breaks, $90 will be the next psychological support to watch out for. We remain bearish on our outlook until price manages to invalidate the bearish trendline.
Canadian Surprise
We can also draw confluence from the Interest Rate decision by the Bank of Canada on Wednesday.
They surprised the market by rocking a full point hike in interest rate. This means they are very far behind and are trying to do more now to keep inflation in check (hopefully).
But what is interesting was what happened to USDCAD.
On Wednesday, the rate hike was announced. But USDCAD stayed still,for a few hours. The market only started to pick up steam and rocketed 250 pips after more than 12 hours from the event.
The Bank of Canada made a surprise move to raise their rates by 100 bps versus the expected 75 bps, but the CAD got weaker against the dollar? IS USD really that strong?
Not to forget that CAD is also a commodity currency. CAD is related to oil price as Canada is one of the largest oil producers and exporters in the world. If CAD is depreciating, what does that mean for the outlook on oil?
Looking at the chart, USDCAD broke out of the channel and also the resistance zone marked in blue and therefore a higher chance of it climbing to the next key area at 1.3350.
As the week comes to an end, let’s recap what happened in the markets, specifically the pairs that we follow.
Economic Calendar
While the beginning of the week was filled with market news and announcements, there is one important event to end the week and that is the Core PCE Price Index, due at 8.30 am EST Friday. Historically, that should only cause moderate to low volatility to the market. However, inflation and interest rates are some of the hottest trending topic in the markets lately and if there is a huge surprise in numbers, we can expect a shift in investors’ sentiment.
FOMC Recap
The Fed raised the interest rate by the forecasted 75 bps to 2.25%-2.5% range.
Let’s review what Fed Chair Powell said.
Powell rejected the notion that the U.S. economy is in, or soon to be in a recession as firms continue their hiring in excess of 350,000 additional workers each month (We can look at the past NFP numbers). This may help calm the recessionary fears that have swept the markets recently. However, he acknowledged that the economy might need to slow down a little more for them to contain inflation.
We can infer from the reactions on gold and USD pairs that the market received a more dovish signal from the Fed via the FOMC meeting, which caused the expectation for the next rate hike in September to lower down a notch, from 75bps hike to a half point hike.
Precious Metals
Gold

XAUUSD H4 Chart. Source: Tradingview
The Fed raised rates by the expected amount. While the greenback should get stronger against gold, the reality is the other way around given that there were no surprise from the Fed and market expectations have been priced in. Therefore, we observed a recovery of $46 on gold since the announcement. Besides, the Fed is seen to be more dovish than what the market expected previously, which caused USD to lose strength against other assets and currencies.
It is currently faced with 1770 resistance which corresponds to a 200 period moving average as it is trying to break through the trendline. Traders will need to pay attention to see if gold can break above this level. There will be short opportunities if price fails to break out. In an alternative scenario, 1785 might be an interesting area to look for shorts if this is going to be a fakeout.
The Fed raised rates by the expected amount.
| Technical Levels | Price Zone |
| R2 | 1785 |
| R1 | 1770 |
| S1 | 1710 |
| S2 | 1680 |
Forex
EURUSD
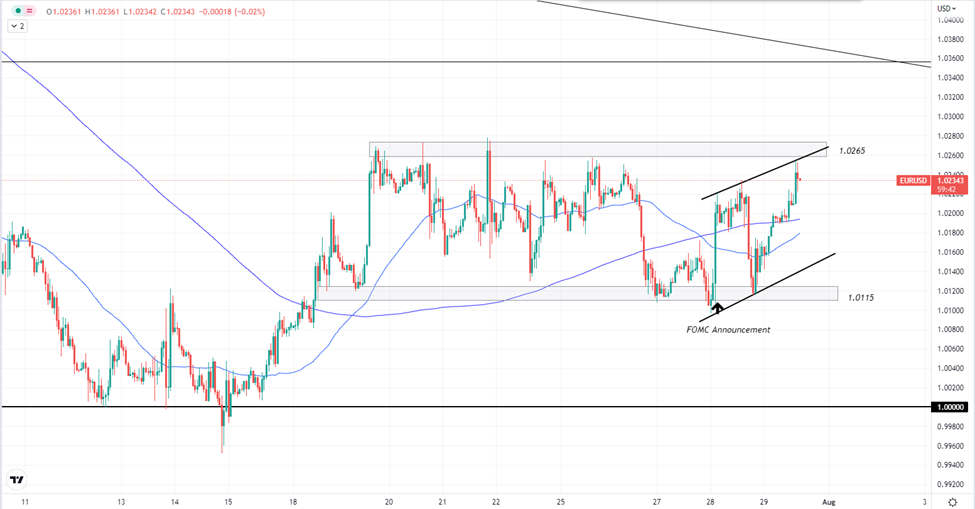
EURUSD H1 Chart. Source: Tradingview
The greenback got relatively weaker after the interest rate decision. EURUSD jumped from the lower boundary of the consolidation following the news and is now approaching the upper boundary of the range. The pair has also created a bullish market structure along the way with higher highs and higher lows, forming a bullish channel.
A breakout to the upside is possible, but again we have to take USD’s strength into consideration with the Fed expected to raise rates in the following meetings.
| Technical Levels | Price Zone |
| R2 | 1.0360 |
| R1 | 1.0265 |
| S1 | 1.0115 |
| S2 | 1.0000 |
Energies
WTI Crude
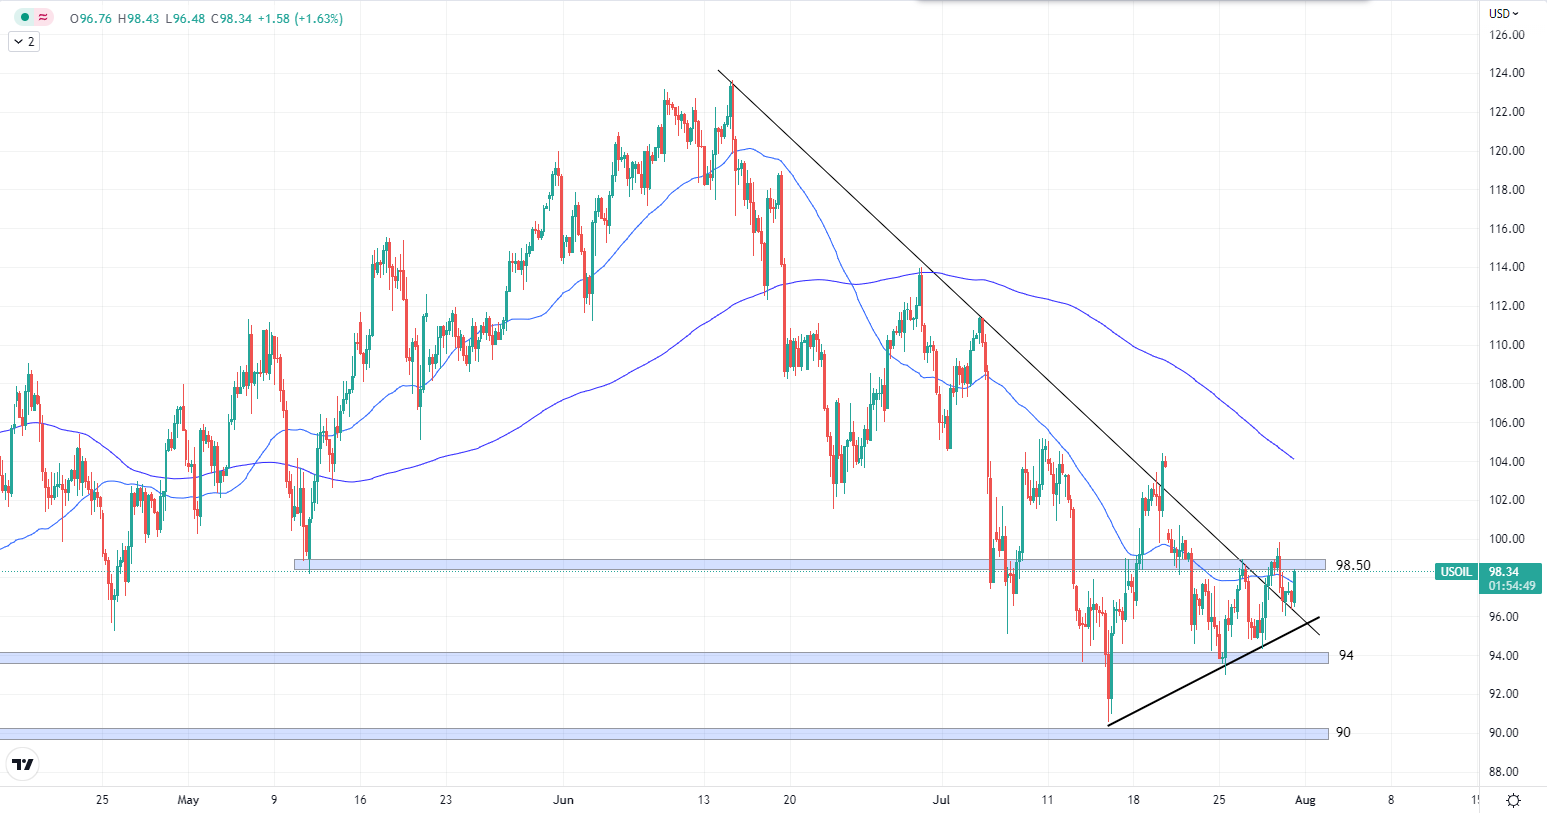
USOIL H4 Chart. Source: Tradingview
Following the FOMC meeting and Powell’s statement, the sentiments are starting to shift from being plagued by recessionary fears to an undersupply in the oil markets.
A key event to keep an eye out for is the OPEC+ meeting that will take place on 3rd of August, 2022. U.S. President Joe Biden also visited Saudi Arabia to have talks on oil production 2 weeks ago on July 15th, which could have increased the chance of an increase in oil output.
From a technical standpoint, oil price steadies and made higher lows. It is now sitting above the broken trendline and is testing $98.50 resistance. A breakout to the upside and back to triple digits is likely based on the factors we discussed.
| Technical Levels | Price Zone |
| R2 | 104.00 |
| R1 | 98.50 |
| S1 | 94.00 |
| S2 | 90.00 |
US Stocks Market
SP500
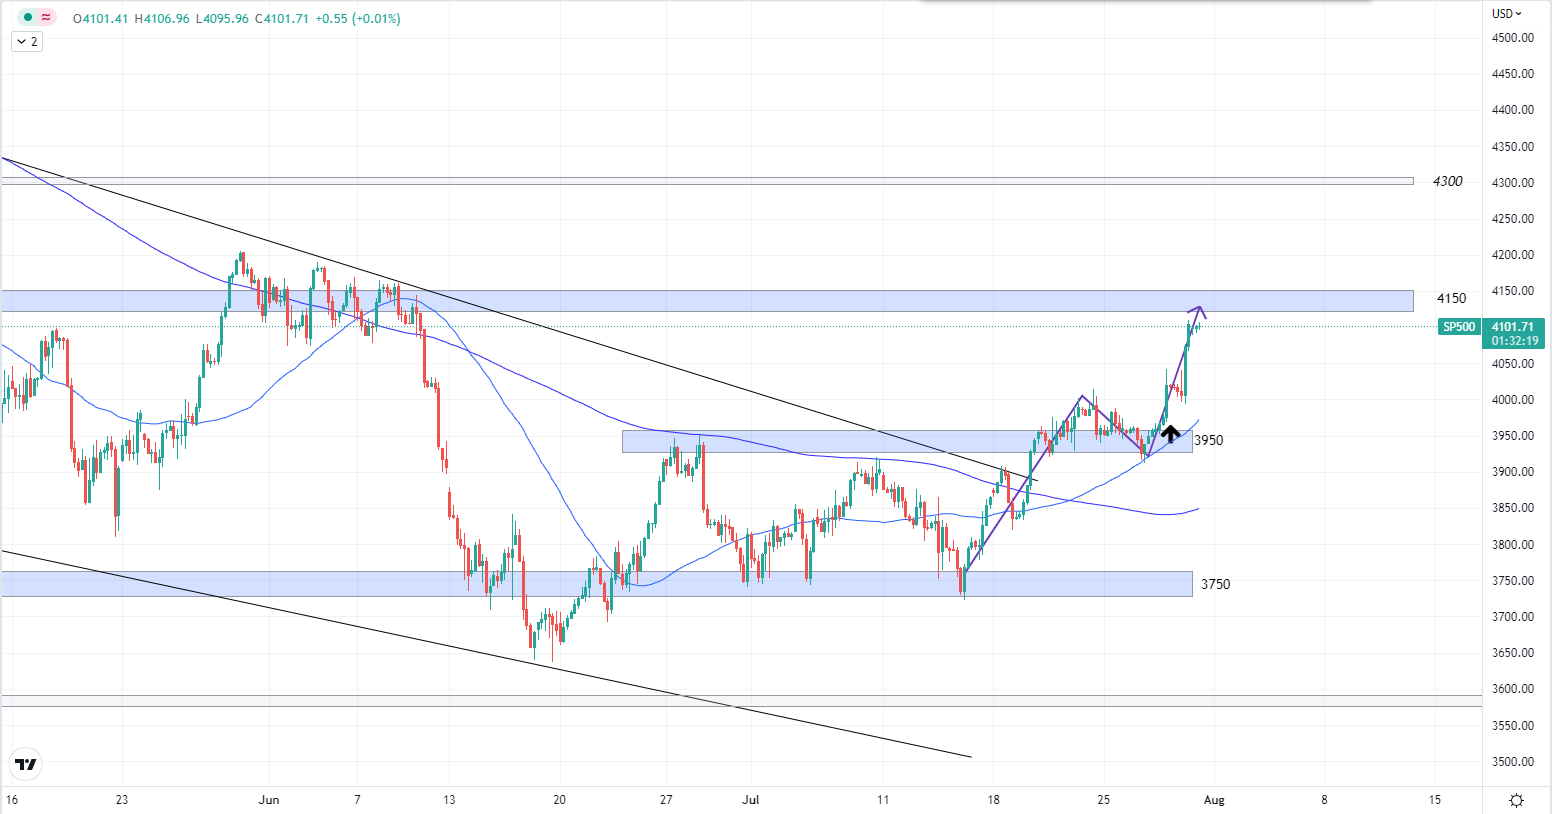
SP500 H4 Chart. Source: Tradingview
The US stock market in general reacted favourably to the interest rates announcement. We are seeing some slow and steady recovery for SP500 after a prolonged period of down trend. Marked on the chart with an arrow is when the news was released and we observed a jump in prices.
In terms of technical analysis, SP500 broke out from its bearish channel and did a textbook retest on a broken resistance-turned-support at 3950. Now, it is heading towards 4150 resistance and we shall see if it is able to break through. If it does, 4300 will be our next target. Also, the 50 MA crossed over the 200 MA, which served as a bullish confluence for SP500.
| Technical Levels | Price Zone |
| R2 | 4300 |
| R1 | 4150 |
| S1 | 3950 |
| S2 | 3750 |
Cryptocurrencies
Bitcoin

BTCUSD H4 Chart. Source: Tradingview
The largest cryptocurrency also benefited from the FOMC news where it jumped by more than 13% following the event. Currently testing its previous swing high of $24320, it is poised for a breakout and continue to test a higher resistance at $25418.
Is the hope coming back for the Bitcoin hodlers?
| Technical Levels | Price Zone |
| R2 | 25418 |
| R1 | 24320 |
| S1 | 20750 |
| S2 | 19000 |
Welf
Technical Analyst
________________________________________________________________________________________________________________
Want to trade more than 300+ instruments with raw spreads starting from 0 pip and commissions as low as $2 per lot per side?
Sign up with FXPIG now!
Economic Calendar
| Day | Events |
| Monday | BOE governor Bailey speaks |
| Tuesday | – |
| Wednesday | BOE governor Bailey speaks NZD and CAD interest ratesBOC monetary policy report and press conferenceUS CPI 830 am EST |
| Thursday | US PPI |
| Friday | US Retail sales |
Forex
EURUSD
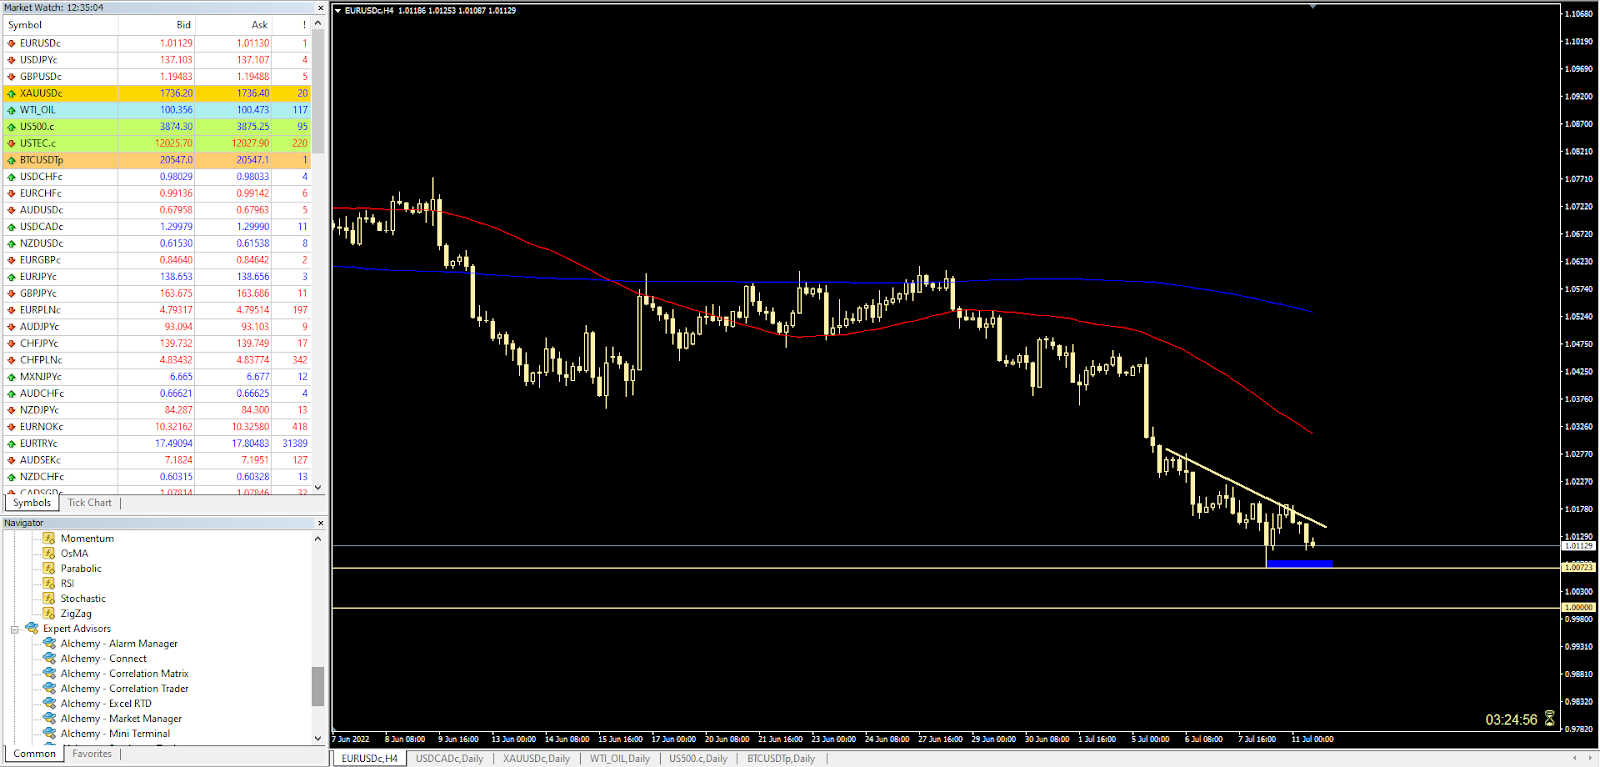
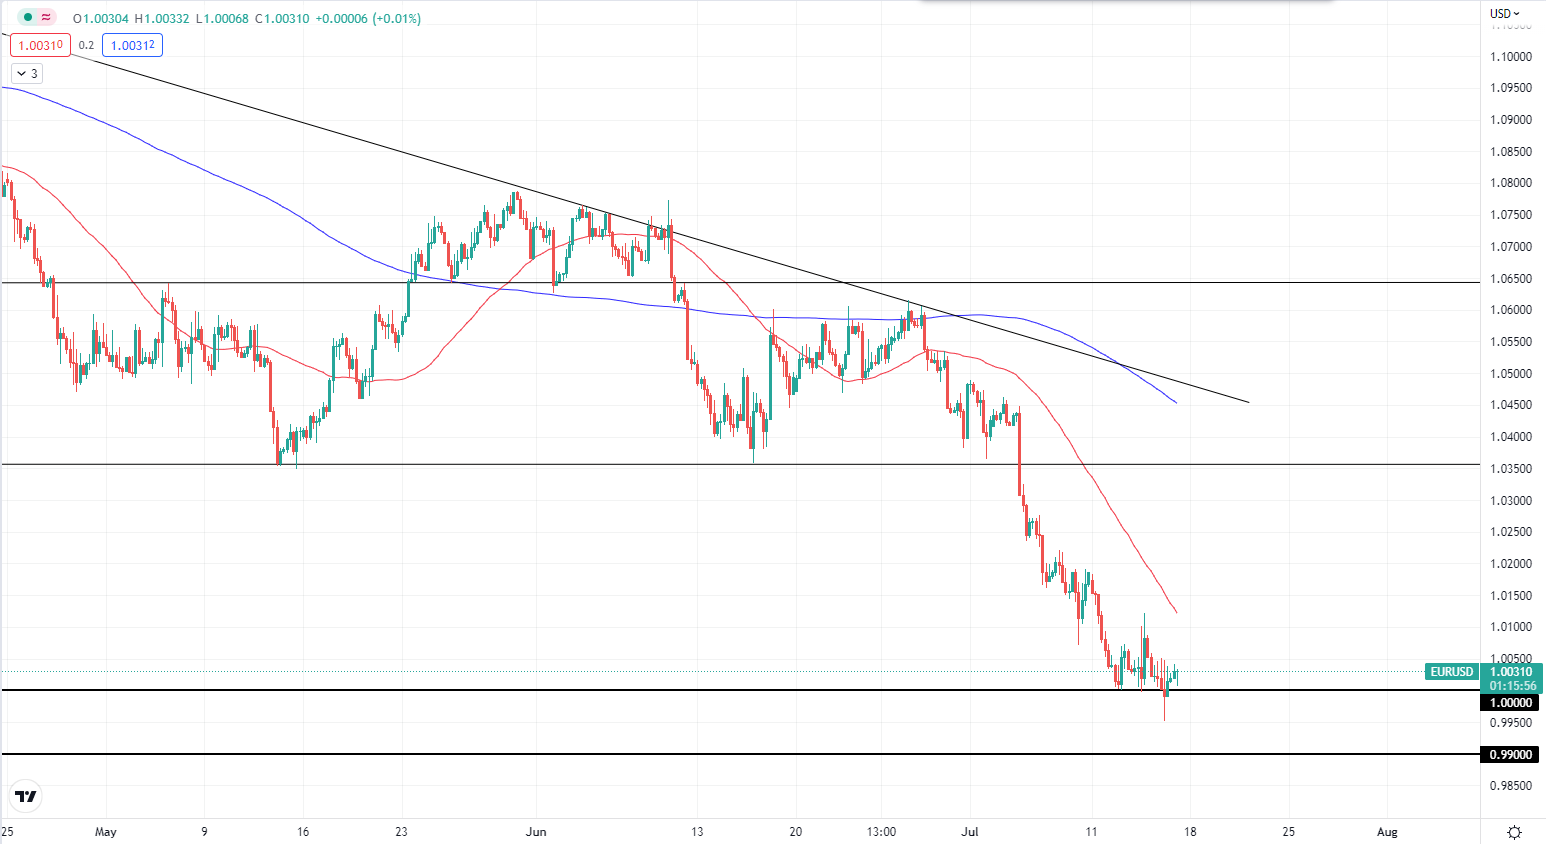
EURUSD H4 Chart
The pair has been making consistent lower highs as marked by the descending trendline. The immediate support is marked in blue near the recent swing low. Considering the build up in bearish momentum, there is a high chance parity will be tested by the end of the week, but still CPI data is going to play a major role in determining the sentiment of USD.
| Technical Levels | Price Zone |
| R2 | 1.02790 |
| R1 | 1.01935 |
| S1 | 1.0072 |
| S2 | 1.0000 parity |
USDCAD

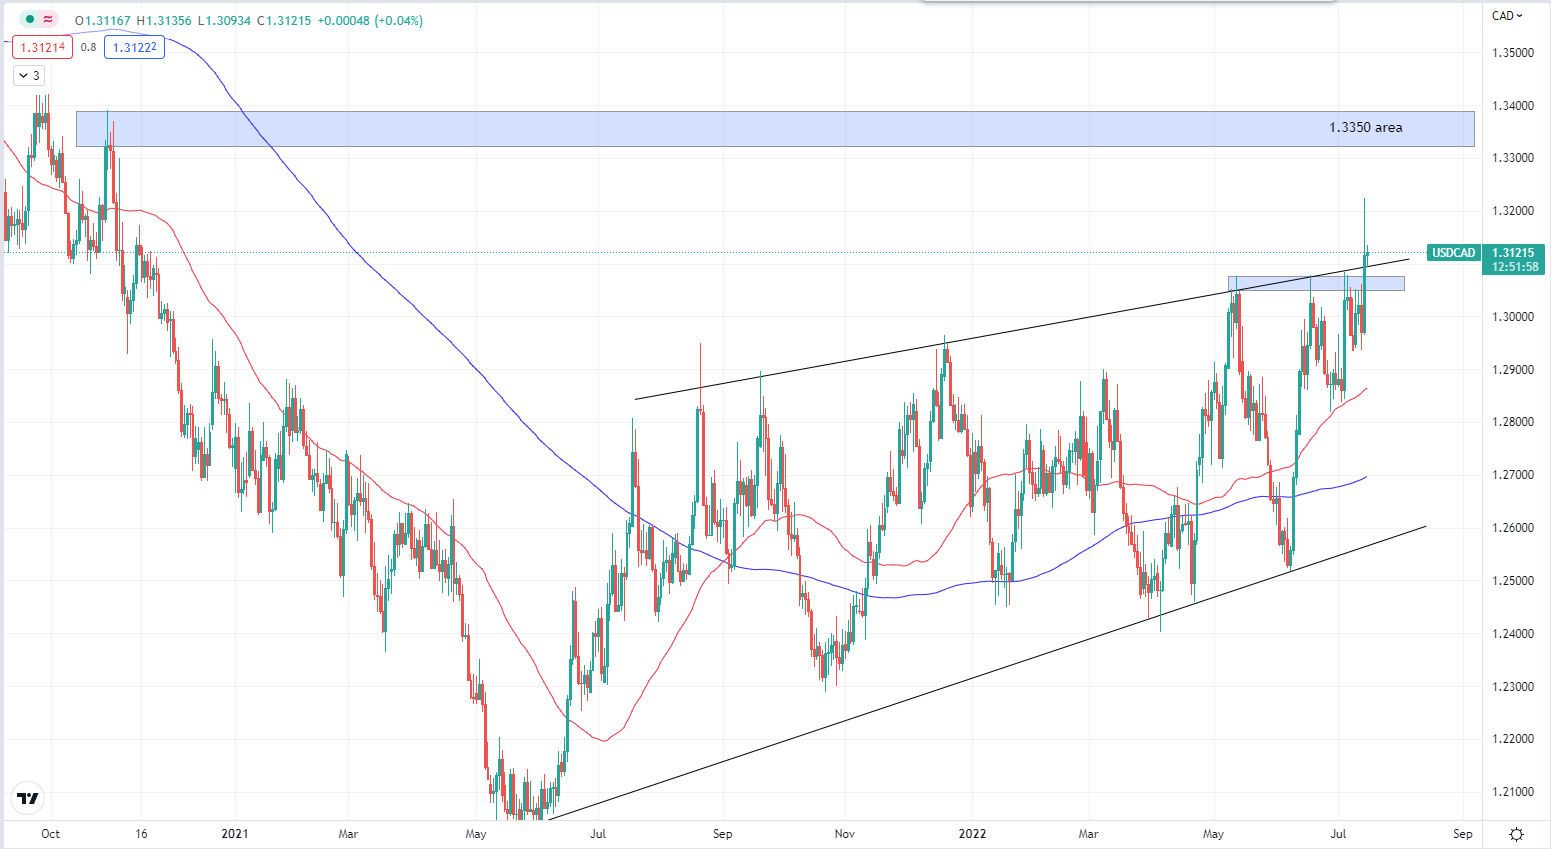
USDCAD Daily Chart
The BOC is expected to raise their rates by 50 bps on wednesday. Technically the CAD is going to gain in strength with a rising interest rate but the question is whether this has been priced in to the markets already.
Not only that, but the Fed is also expected to continue their rate hike throughout the year so we are looking at who is raising their rates higher and faster and also market’s expectations towards the currency.
Looking at the chart, it is in a bullish channel with consecutive higher highs and higher lows. The strength of the most recent up moves have also been relatively stronger than their pullbacks/ retracements. Let’s see if the interest rate decision on wednesday can turn the table around. For now, 1.3075 remains the key resistance and should it break, we may be looking at 1.3340 in the short term which is less than 300 pips away.
| Technical Levels | Price Zone |
| R2 | 1.3340 |
| R1 | 1.3075 |
| S1 | 1.2833 |
| S2 | 1.2712 |
Precious metals
Gold
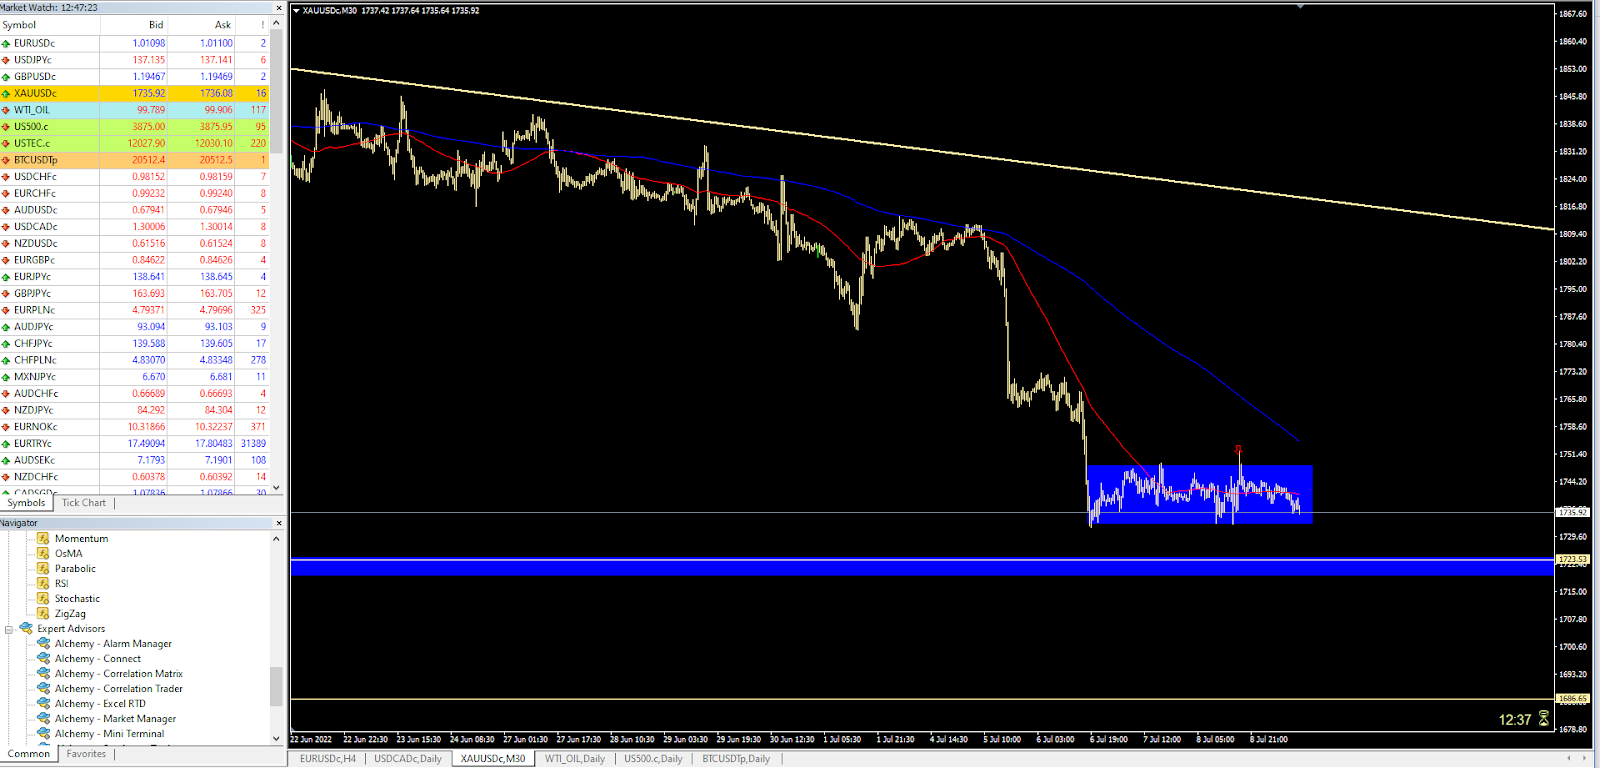
Gold M30 Chart
Gold spiked to a high of 1751 following better than expected NFP numbers which came out at 372k versus the expected 260k. It then quickly calmed down and is currently trading below the 50 period moving average. Looks like gold is preparing for a breakout frmo the consolidation zone to the downside.
Next immediate support can be found at 1723 area, but since strong impulsive moves are usual following a breakout from a tight range, the level could be broken easily and gold may proceed to test 1680 area which has been a major support over the past 2 years.
| Technical Levels | Price Zone |
| R2 | 1752 |
| R1 | 1748 |
| S1 | 1723 |
| S2 | 1686 |
Energies
Crude oil

Crude Oil H4 Chart
The major attention is on china covid’s situation right now as they discovered a new variant which led to a minor jump in cases. The impact of this new discovery is magnified with China’s covid zero policy and investors are worried about a new wave of mass testing which could dampen fuel demand. Not only that but recessionary concerns still remains with a lot of central banks tighten their monetary policy which could lead to a gloabl economic slowdown and fuel demand could suffer.
Oil opened at 104.8 during Asia and has been trading lower since> it is currently sitting on a minor support level which I don’t think it will hold for long after price rejected the resistance level at 104.50. If the support breaks we are looking at it testing the major swing low at $96 again.
| Technical Levels | Price Zone |
| R2 | 106.2 |
| R1 | 102.9 |
| S1 | 99.4 |
| S2 | 94 |
US Stocks market
SP500
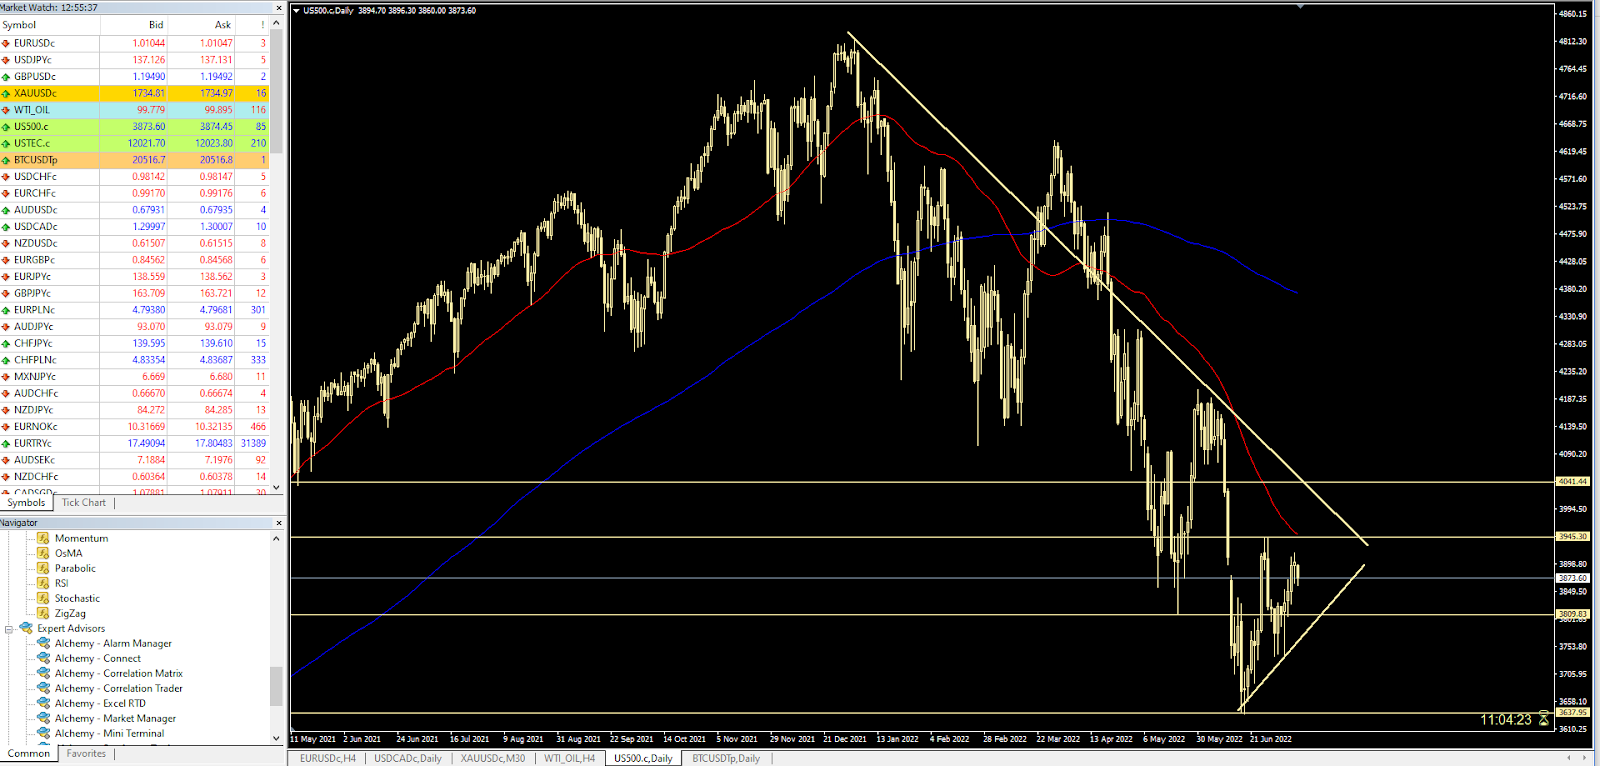
US500 Daily Chart
The US Stocks market has had a decent week last week, bagging minor gains of 2.06%. At least it is still in the green.
From a technical point of view, it is starting to close in a tigher range. Upside is still limited by the bearish trendline accompanied by the 50 day SMA. All eyes are on the CPI numbers later this week and we are just sitting on our hands.
| Technical Levels | Price Zone |
| R2 | 4040 |
| R1 | 3945 |
| S1 | 3810 |
| S2 | 3638 |
Welf
Trader, Technical Analyst
________________________________________________________________________________________
Don’t miss out on BIG market moves!
Want to trade more than 300+ instruments with raw spreads starting from 0 pip and commissions as low as $2 per lot per side?
Sign up with FXPIG now!
Economic calendar
There is NFP today to end the trading week, with a forecasted slowdown in new jobs added at 260k versus 390k for the previous month’s reading. Even with jobs growth slowing down, is it sufficient to tame the strong USD down?
Forex
EURUSD

EURUSD Daily Chart
The pair faced little to no resistance on its way down in the past couple of days, and it is exactly 100 pips away from reaching parity at the time of writing. There is a high chance that NFP is going to provide the volatility needed for a quick test at parity. Please be aware as there could be a strong fakeout and whipsaws in prices while everybody is flocking into the markets at this key time.
One interesting thing to note is this:

Daily Chart of EURUSD on cTrader
Notice how 77% of retail traders are buying into this bearish trend? Since most retail traders are wrong most of the time, this sentiment tool can be used as a great confluence for our trading.
From the chart we can also see that Trading Central’s Technical Views is giving their preference of going short with a target at 0.9950 area. The next important question to ask is whether the buyers can hold their grounds at 1.0000.
Precious Metals
Gold

Gold Daily Chart
The death cross that we were looking at earlier solidified and gold tumbled. Although it was relatively quiet yesterday, it lost about $70 on Tuesday and Wednesday collectively. The next support is near at $1720 but really the key zone that we are eyeing for is 1680 as we the previous bounces from that key area is quiet obvious. We are more inclined towards the bearish side as there is significant downside momentum going on.
Energies
USOIL

USOIL H4 Chart
Technical-wise, US crude is currently in a solid bearish channel with $105 as its resistance and $96 as the support. Lower highs and lower lows reflect the lack of investors’ confidence in global oil demand with increased recessionary concerns amid rapid interest rate hikes across major central banks. We expect the price to test the upper boundary of the channel and that is when the bears may take over and keep the price trading within the channel.
US Stock Market

SP500 Daily Chart
Similar to Crude oil, SP500 has also been trading in a bearish channel. It has had a decent week up till now, and we shall see how NFP affects the market later. Recessionary concerns will be the main factor that limits further upside movements in the stock markets in the short term. Resistance and support levels are marked at 3950 and 3750 respectively.
Cryptocurrencies
Bitcoin

BTCUSD Daily Chart
Still no significant moves on Bitcoin, but it has bagged some decent gains over the past week (+12.9%).
The range of 22910 and 17620 remains intact until further breakout.
Welf
Trader, Technical Analyst
________________________________________________________________________________________
Don’t miss out on BIG market moves!
Want to trade more than 300+ instruments with raw spreads starting from 0 pip and commissions as low as $2 per lot per side?
Sign up with FXPIG now!
Economic Calendar
| Day | Events |
| Monday | US Bank Holiday |
| Tuesday | AUD Interest Rates |
| Wednesday | ISM Services PMI, FOMC minutes |
| Thursday | ADP Non-farm employment change |
| Friday | ECB Lagarde speaks, NFP, US unemployment rate |
*Only key events are listed
AUD: More rate hikes
The RBA is expected to raise rates for the third consecutive meeting on Tuesday to combat inflation.

Source: Trading Central – Economic Insight
Looking at the past data provided by Trading Central’s Economic Insight, RBA has surprised the markets in the past 2 announcements by raising its cash rate greater than forecasted. Since the last meeting, Governor Lowe has turned more hawkish stating that Inflation could hit 7% by Christmas and will only begin to slow down in early next year. Not only that but Lowe also suggested that a reasonable cash rate would be 2.5%. 25bps/ 50 bps hike at this next meeting was also expected, Lowe noted.
AUDUSD

AUDUSD Daily Chart
The Aussie has been trading lower against the greenback since a death cross occurred towards the end of May. A descending triangle also foreshadowed the break at the 0.6850 support level. Currently trading at 0.6800, we may see the momentum carry on until the key level of 0.6700 before we see some sort of reaction. Although a climbing cash rate would make the AUD stronger, the Fed is raising its interest rates too. It is now a question of which currency has a more bullish expectation moving forward.
FOMC Minutes for June 2022
The fed said in its last meeting that an ongoing rate hike would be appropriate and that they are strongly committed to returning inflation to its target level of 2% over time. Fed Mester said, “debate in July is between 50 bps and 75 bps rate hike.” and she would prefer the latter. The updated economic projections forecasted rates rising to 3.25-3.50% by the end of this year;
EURUSD Daily Chart
If the USD continues to strengthen against other currencies, and specifically the Euro, in this case, 1.0350 would be broken easily. Underneath that level is a price territory that the fiber has not visited for the past 19 years with 1.0190 as the next support level. If that level is breached further, the question then becomes will EURUSD reach parity.
Precious Metals
Gold
XAUUSD Daily Chart
Trading volume on gold today will likely be flat today as it is a bank holiday in the US. Investors are being cautious ahead of this week’s key events including the FOMC minutes, NFP, and ADP report.
From a technical point of view, all eyes are on the impending death cross. Although gold has had a decent bounce from its recent swing low at $1788, the bearish trendline is still intact. Trading at $1813, the important things to look out for are whether the death cross is going to solidify and if the bearish trendline is going to keep gold price in check.
Energies
US Crude

USOIL Daily Chart
WTI is still trading under the broken trendline which limits upside movement. The primary factor for the current bearish sentiment is the recessionary fears which dampen fuel demand, although the supply for oil remains tight as sanctions on Russian oil remain in place and a lower OPEC output. Growing USD strength also weakens the commodity markets as the purchasing power of the USD increases.
Cryptocurrencies
Bitcoin

BTCUSD Daily Chart
Bitcoin is probably sleeping. Volume dies down as capital flees from risk assets amid recessionary fears. investors also have to decide between taking on a humongous amount of risk while holding Bitcoin, or putting their money in the Bank or some other higher interest-bearing assets that are relatively stable. Similar to commodities, Bitcoin is mostly quoted in USD and a stronger dollar means a lower value for Bitcoin since the purchasing power of USD is now greater. We are still waiting for Bitcoin to break either side of the trading range between 22910 and 17621, and the latter seems more likely considering the current macroeconomic conditions.
Welf
Trader, Technical Analyst
________________________________________________________________________________________
Don’t miss out on BIG market moves!
Want to trade more than 300+ instruments with raw spreads starting from 0 pip and commissions as low as $2 per lot per side?
Sign up with FXPIG now!
Economic calendar
| Event | Currency |
| ISM manufacturing PMI | USD |
| Canadian Bank holiday | CAD |
| EUR CPI Flash estimate | EUR |
Forex
EURUSD

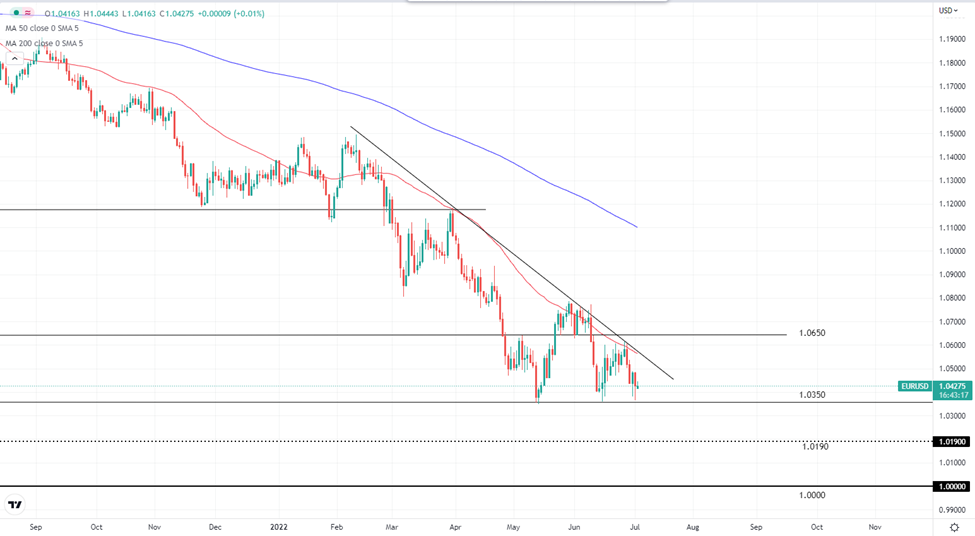
EURUSD Daily Chart
The pair traded lower before the London session begins. The red 50-day moving average acted as a decent resistance where the price did not manage to break past 3 days ago. We are just 100 pips away from the next major support level at 1.0350 while investors are waiting on the sidelines for the release of ISM Manufacturing PMI later tonight.
USDJPY

USDJPY H4 Chart
USDJPY has made a double top formation on the 4 hour chart and also closed below the 50 period moving average. 134.50 is the first line of support to keep the price near decades high. However, there might be a correction soon as the bullish momentum starts to fade (the slope of upward movement is getting less steep). From the chart, 136,56 seems like a strong resistance to keep the bulls in check.
Precious Metals
XAUUSD

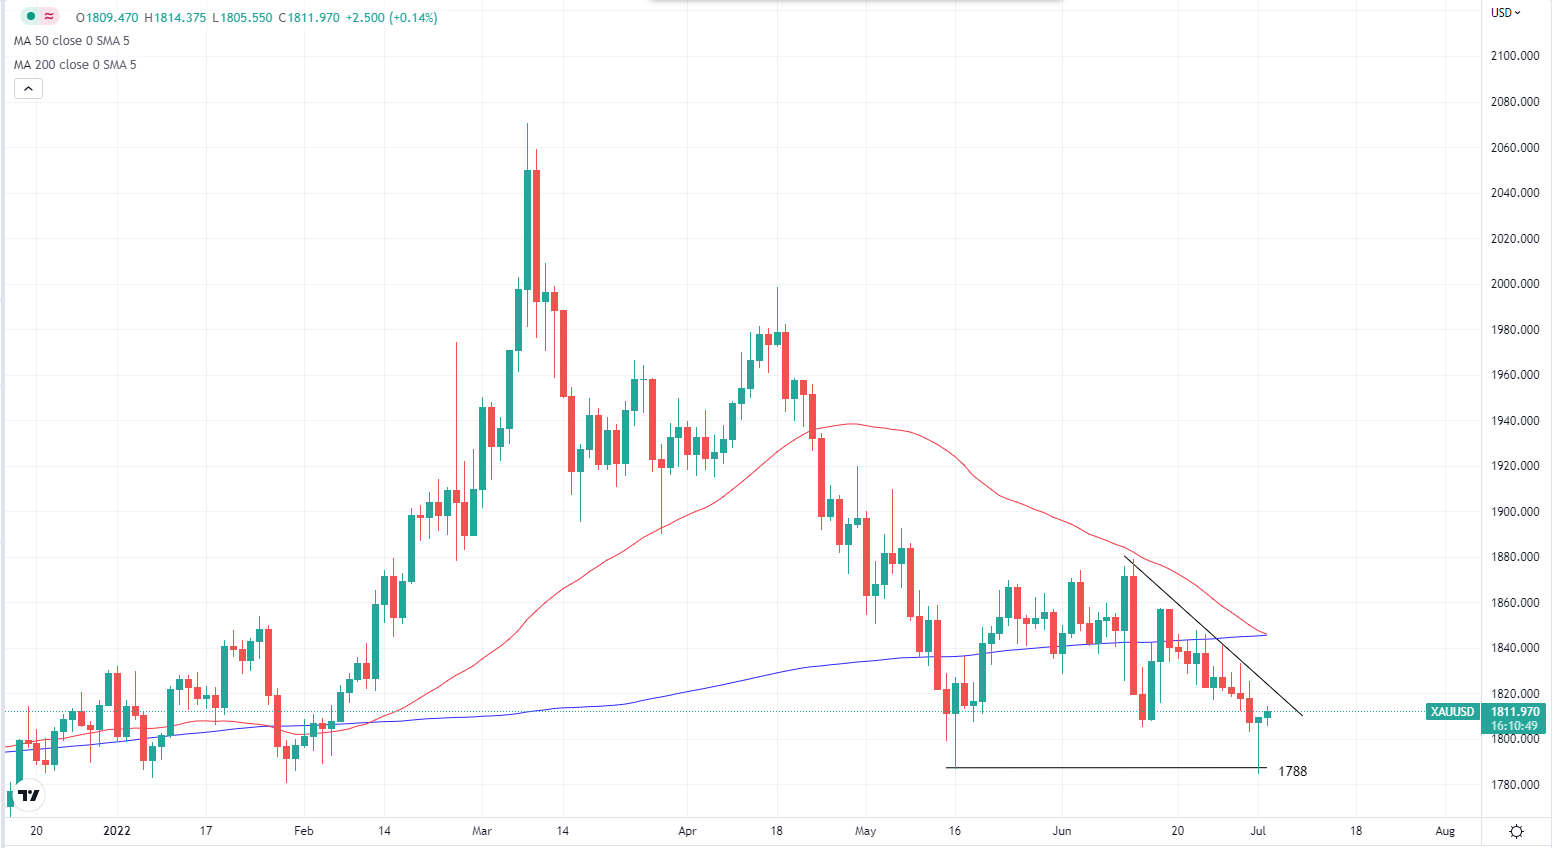
XAUUSD H4 Chart
Gold declined by 1.7% or $31 since the beginning of the week. From a technical perspective, gold made consecutive lower highs and lower lows, which foreshadowed the continuation of a downward trend. The moving averages are also trailing gold prices nicely, and the next key area to watch out for is the recent swing low at $1788. We are currently less than $10 away from that area with PMI data coming out tonight. It is also worth mentioning that today is the first trading day of Q3 so we are expecting some higher volatility to end the week.
Energies
USOIL

USOIL H4 Chart
WTI crude climbed to as high as 114 earlier this week, but the heavy selling pressure came about when the price met the 200-period moving average on the 4-hour chart and turned the tables quickly. At the time of writing, WTI is down almost 2% for the week
The plunge in crude oil prices is said to be caused by the fears and concerns of a global economic slowdown due to widespread inflation and central banks fighting hard to contain them with contractionary policies.
Investors are currently eyeing the $102 key support area. If this breaks, we may see crude trades back to 2-digits. On the other hand, bulls will face significant resistance at the broken bullish trendline and the 200 period moving average.
Cryptocurrencies
BTCUSD

Bitcoin Daily Chart
The situation is looking dire for Bitcoin and Cryptocurrency in general. Bitcoin hasn’t traded past $23k for more than 2 weeks and if we look closer, you can notice the volatility started to die down shortly after the breakout from the blue consolidation zone. Trading at sub $20k, the next support is at the recent low of $17620. If it breaks, we have another support near $16220.
US Stocks
SP500

SP500 Daily Chart
The stock market hasn’t been great for the investors. Today may very well be the fifth consecutive losing day for SP500 should the bears continue to be in charge for the rest of today’s session.
The only mild support that SP500 is getting is from the $3750 area. The bearish channel formation remains solid and we need a break to the upside to signify any trend change.
Welf
Trader, Technical Analyst
________________________________________________________________________________________
Don’t miss out on BIG market moves!
Want to trade more than 300+ instruments with raw spreads starting from 0 pip and commissions as low as $2 per lot per side?
Sign up with FXPIG now!
Economic Calendar
| Day | Events |
| Monday | G7 Meeting |
| Tuesday | G7 Meeting |
| Wednesday | ECB’s Lagarde, BOE’s Bailey and Fed’s Powell speaks |
| Thursday | Core PCE Price Index |
| Friday | ISM Manufacturing PMI, Canadian Bank Holiday |
Headlines
Russia defaulted on its foreign-currency sovereign debt of about $100 Million. G7 to ban Russian gold.
Fed’s Bullard said a rapid rise in interest rates now is the best way to avoid recession later.
Forex
EURUSD
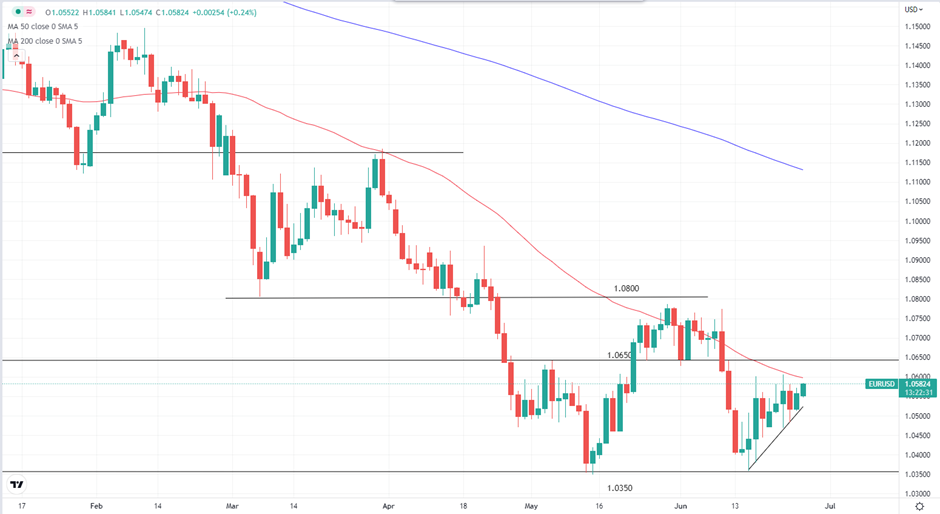
EURUSD Daily Chart
EURUSD is getting a good start for the week as it rose 0.24% before the European session begins. However, 50 DMA and 1.0650 will be the first line of resistance for the bulls. If USD strength resumes, we may see the pair move down to test 1.0350 again. Also, it is the final few days before the second quarter ends so we expect more volatility in the coming days.
Precious Metal
Gold

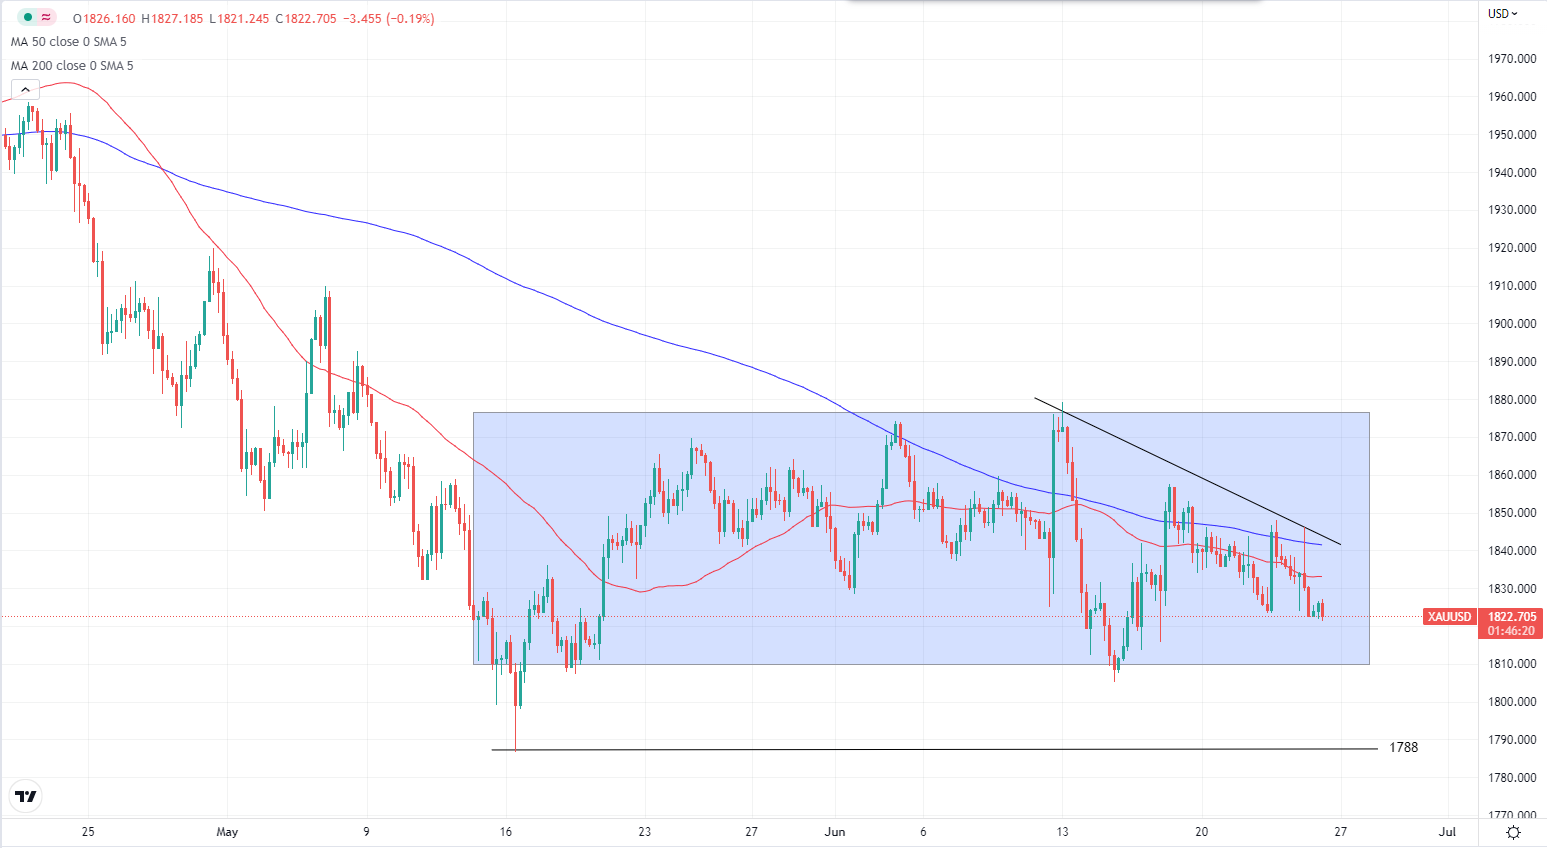
XAUUSD H4 Chart
Gold climbed 10 dollars to start the week of trading.
Fierce resistance is keeping gold prices in check. The 50 and 200-period moving averages and a bearish trendline are applying bearish pressure on gold.
If it breaks, we shall see gold testing $1860. However, there is a higher tendency for gold to move downwards as it has been creating lower highs, with $1788 as the short-term target.
Energies
US Crude

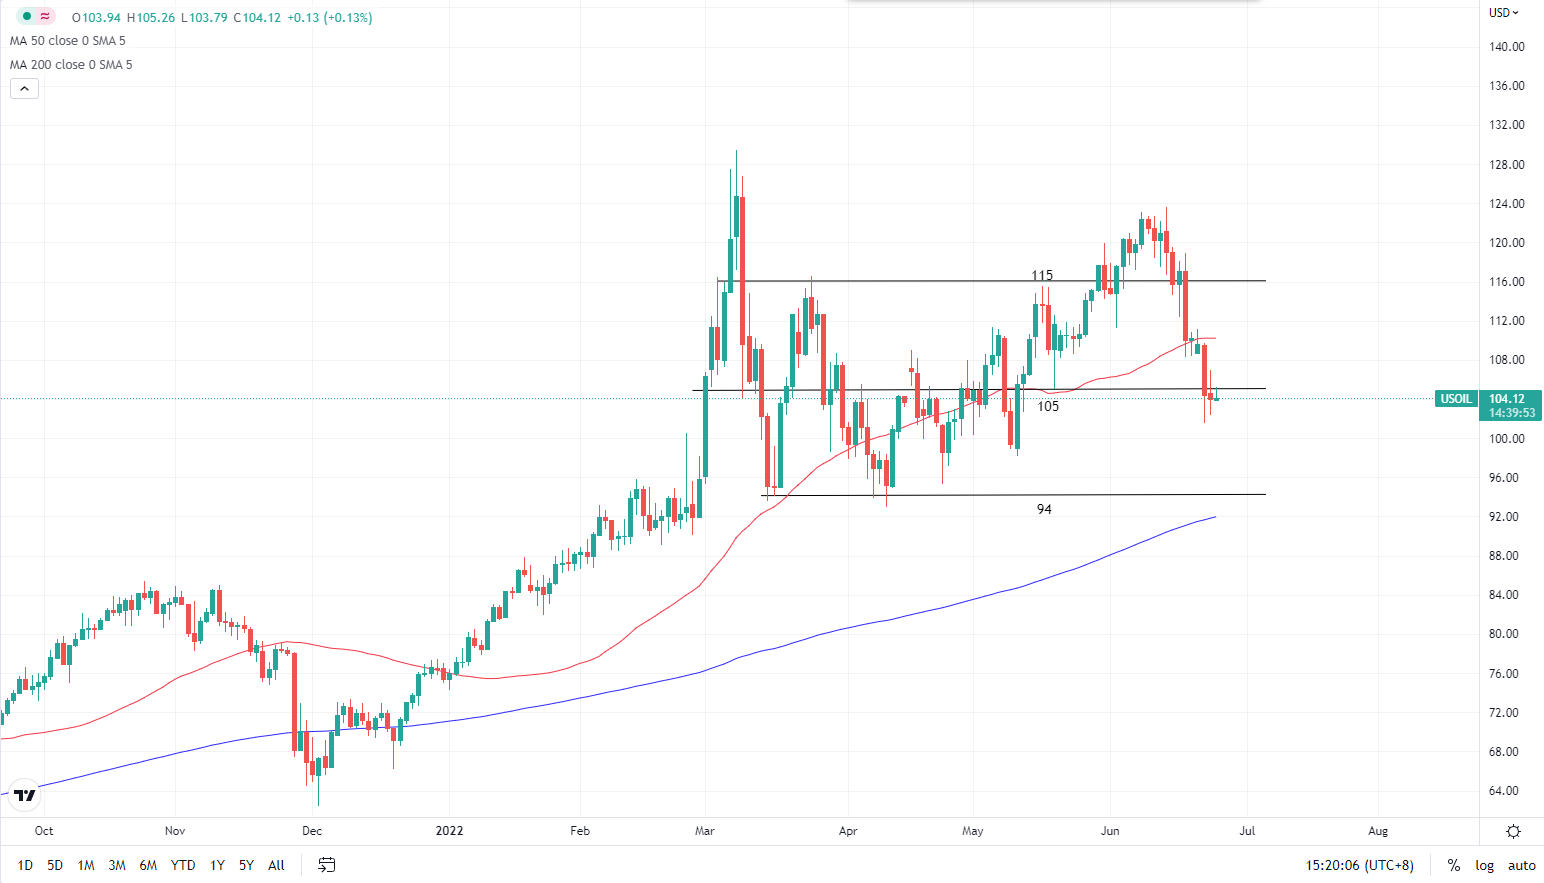
USOIL Daily Chart
US Crude recovered to close the previous week at -2.25% while investors remain alert to the potential sanctions and talks on Russian Oil and Gas bans during the G7 meeting. Currently, there is a tug of war between the concern of a potential recession and the pressing supply issues, which are partly relieved by the accelerated output of OPEC+ and a potential revival of the Iran Nuclear Deal.
The midpoint of the range, $105 still provides some support to Oil prices. The probability of the price resuming its bullish trajectory is higher and hence our short-term target at $115.
US Stocks
SP500

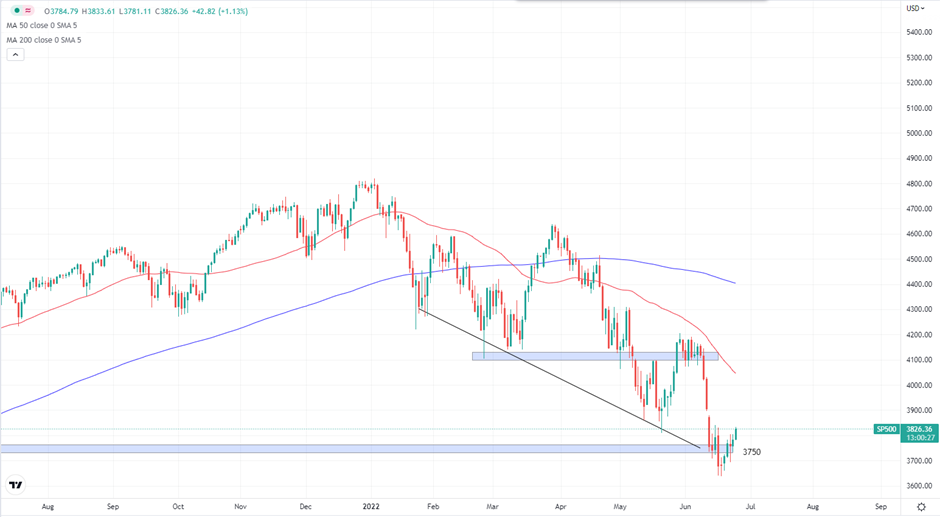
SP500 Daily Chart
Big gains last week for the US stocks market with SP500 closed +6.31%. However, it remains in a bearish channel and a 4100 key resistance to break should it wants to recover to where it was at the beginning of the year. Fed Chair Powell, due to speak on Wednesday may cause some market movements this week. The boundaries of the channel will be the immediate support and resistance, and key levels at 3750 and 4100.
Cryptocurrencies
BTCUSD
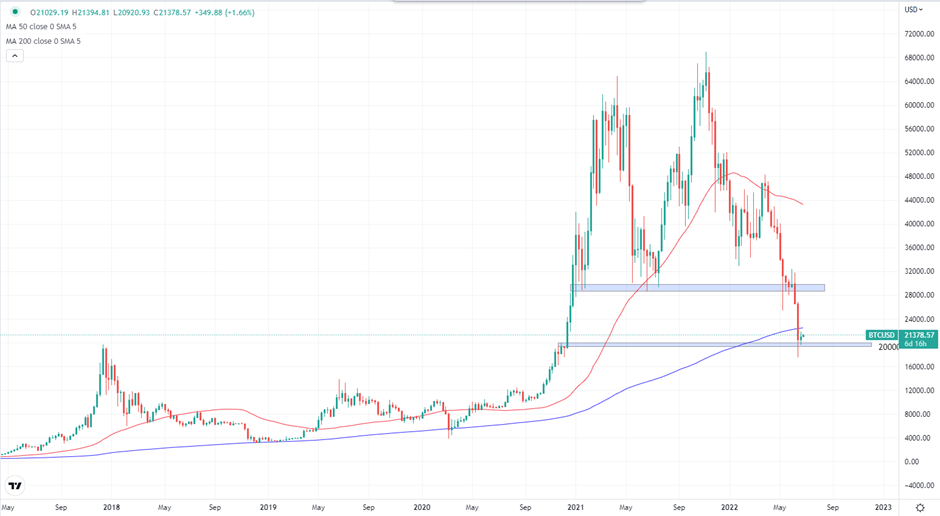
BTCUSD Weekly Chart
Bitcoin was taking a breather from the sharp decline 2 weeks ago. It managed to make a 2.3% gain while holding its ground above the 20k mark.
$20,000 will be the key support while resistance is at the $28,000 area.
Welf
Trader, Technical Analyst
________________________________________________________________________________________
Don’t miss out on BIG market moves!
Want to trade more than 300+ instruments with raw spreads starting from 0 pip and commissions as low as $2 per lot per side?
Sign up with FXPIG now!
Economic Calendar
| Day | Event |
| Friday | NZD Bank Holiday |
Forex
EURUSD
EURUSD H4 Chart
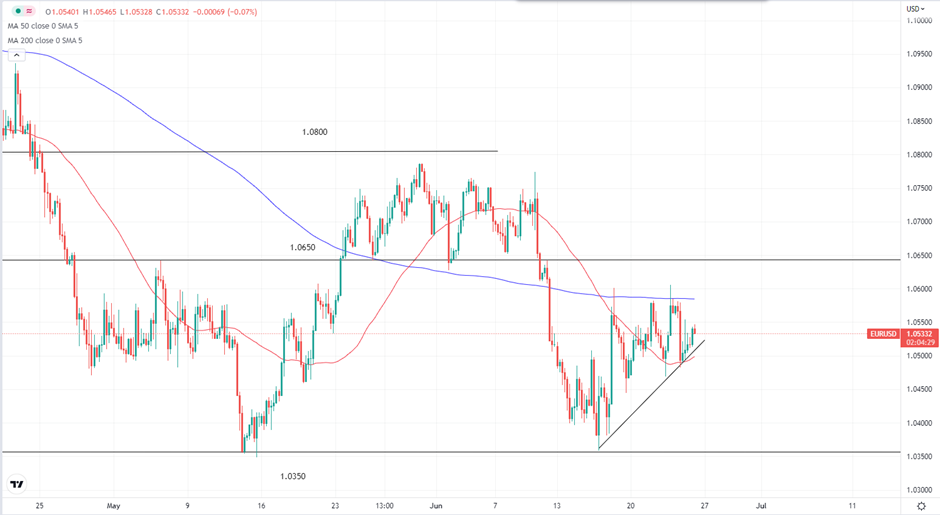
The fiber has been edging higher towards the 1.06000 key level, currently trading at 1.05 ish between the 50 and 200 moving average. Consecutive higher lows created a bullish trendline on the 4-hour chart and the pair may be more inclined to the bullish side in the short term, with the PMI coming out lower than expected (52.4 vs 56)
Precious Metal
XAUUSD
Gold H4 Chart
With lower highs being made and both moving averages applying downwards pressure, gold is positioned for a bearish break from its consolidation range. It traded as high as 1846 before the PMI figures were released. It plunged shortly after the announcement to a low of 1822.60. If it does break from its current range, the first target price level is 1788.
Energies
Crude Oil
USOIL Daily Chart
Crude oil tumbled 5.35% this week. The aggressive rate hike by the Fed is triggering fears that the economy may slide into a recession and reducing the demand for crude oil which cause the sell-off in crude over the past 2 weeks. After an indecisive day yesterday (-0.4%), we shall see if crude will extend its sell-off to end the week lower. Underneath is the $94 key support coinciding with the 200 daily moving average.
US Stocks
SP500
SP500 Daily Chart
SP500 is slowly recovering to trade above 3750 again after 2 consecutive weeks with more than a 5% loss. If the index can hold on to its gains later during the NY session then we will be looking at a green week. The next key level to watch out for is 4000 which will most likely coincide with the 50 daily moving average.
Fed Chair Jerome Powell toned down his language when he testified before the lawmakers on Thursday, stating that the Fed is “strongly committed” to fighting inflation compared to the term “unconditional” that was used previously.
Cryptocurrencies
Bitcoin

BTCUSD Weekly Chart
Having lost 70% of its value from its all-time-high, market-leading cryptocurrency Bitcoin is hanging on to its life. With the strong bearish momentum that is building up, we are doubting if 20000 can hold. The next key price will be its first all-time-high at 19k ish.
Welf
Trader, Technical Analyst
________________________________________________________________________________________
Don’t miss out on BIG market moves!
Want to trade more than 300+ instruments with raw spreads starting from 0 pip and commissions as low as $2 per lot per side?
Sign up with FXPIG now!
Economic calendar
Key Events for this week
Monday- Australian Bank Holiday
Tuesday- USD PPI
Wednesday- FOMC Statements and Federal Funds Rate. There will be an FOMC press conference 30 minutes after the statements
Thursday- CHF interest rates, GBP Interest rates
Friday- Fed Chair Powell speaks
Inflation: CPI Recap
CPI figures last Friday surprised us, but not in a good way. Both CPI and Core CPI came out higher than expected with CPI rising 8.6%YoY and core inflation at 6%. Fuel oil alone was up 106.7% over the past year, can you imagine paying double on your car fuel? Well, you don’t need to imagine anymore as that is the reality in the US now.
USDJPY
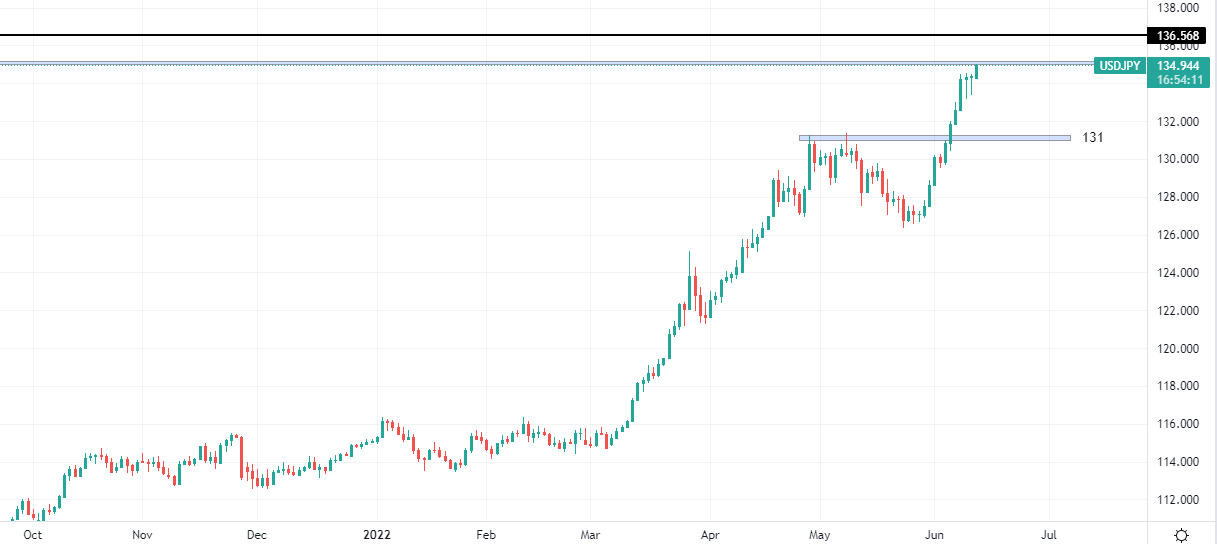
USDJPY Daily Chart
Following up on our analysis last Friday, USDJPY did continue to rally as predicted. Yen slumps to a 20-year low as BOJ stands firm on their easing monetary policy unless the pair breach 140 in an effort to support their slow recovery from the pandemic. Governor Kuroda also emphasized that exchange rates aren’t policy targets. With the Fed expected to raise its interest rates by another 25 basis points during the FOMC statement later this week, the Yen might slide further. The next resistance is marked at 136.50 area but please note that this level is formed 24 years ago. The next medium-term support is at 131.
EURUSD
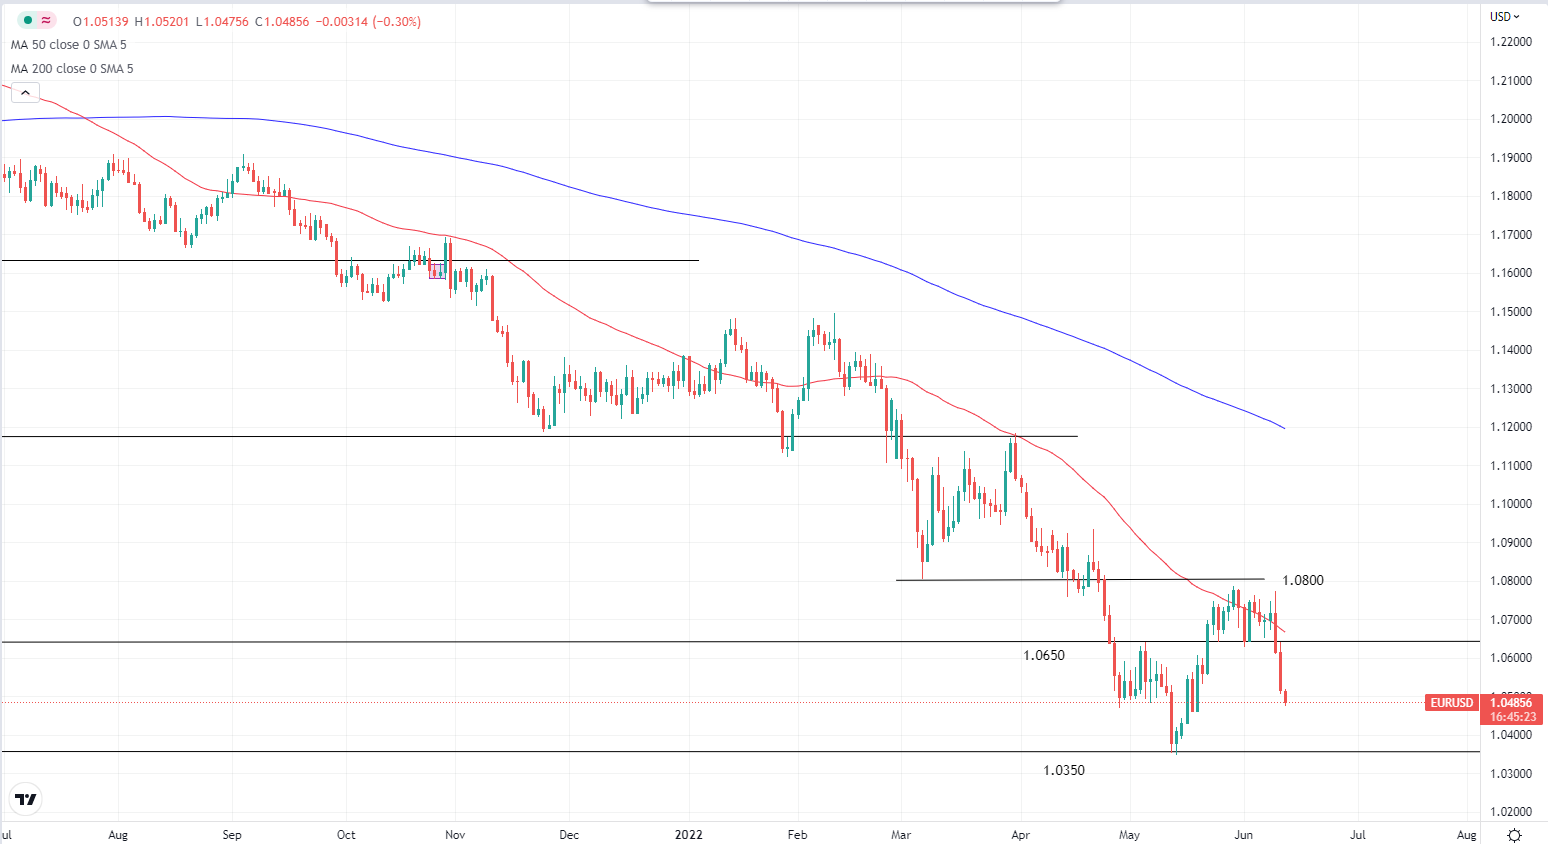
EURUSD Daily Chart
The Euro continued to weaken against the US dollar ahead of the interest rates announcement this week. Technical-wise, the price respected the 50 daily moving average and resume its bearish movement. Currently trading at 1.0488, the pair is looking very likely to test the next support at 1.0350 due to the USD’s strength.
GBPUSD
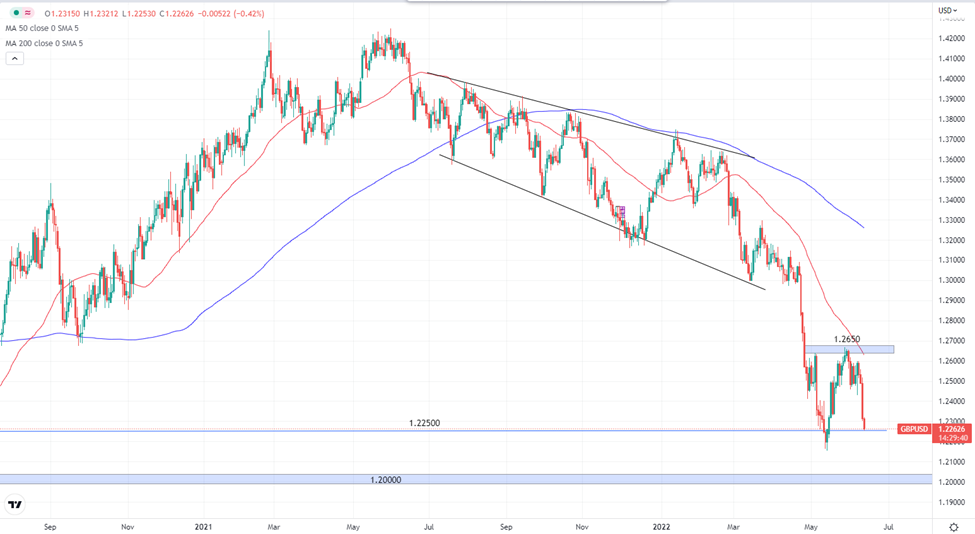
GBPUSD Daily Chart
To meet the inflation target, the BOE is set to raise rates on Thursday by 25 basis points, from 0.75% to 1%. Will this move give the Pound a much-needed boost to turn the trend on GBPUSD, or at least stop the Pound from falling further? It is currently sitting on 1.2250. The next key support is situated 250 pips below while resistance is at 1.2650.
Precious Metals
XAUUSD
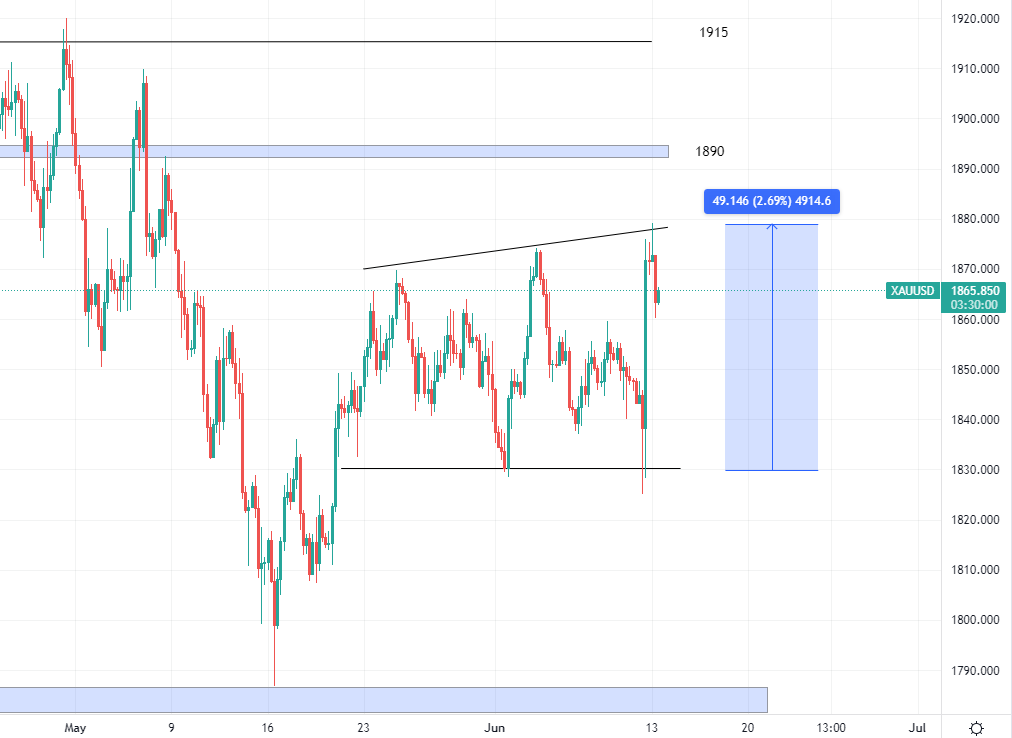
Gold Chart H4
Gold spiked more than $40 after CPI came out last Friday, with the wicks covering both the bottom and the top end of its trading range. We are still waiting for a breakout from this 3-week long consolidation and the FOMC announcements this week may be it.
On the top, we have 1890 as the next resistance and the lower end of the trading range as the support
Energies
Crude Oil

USOIL Daily Chart
Bullish momentum has slowed down on crude oil. Prices fell for 2 consecutive trading days and continued to slide as markets open today. The reason being China warned of a serious spread in Beijing and is conducting more mass testing until Wednesday, which makes China the near-term downside risk for crude prices. The next support is the previously broken resistance at $115 while the upside target is at $129.
US Stocks Markets
SP500
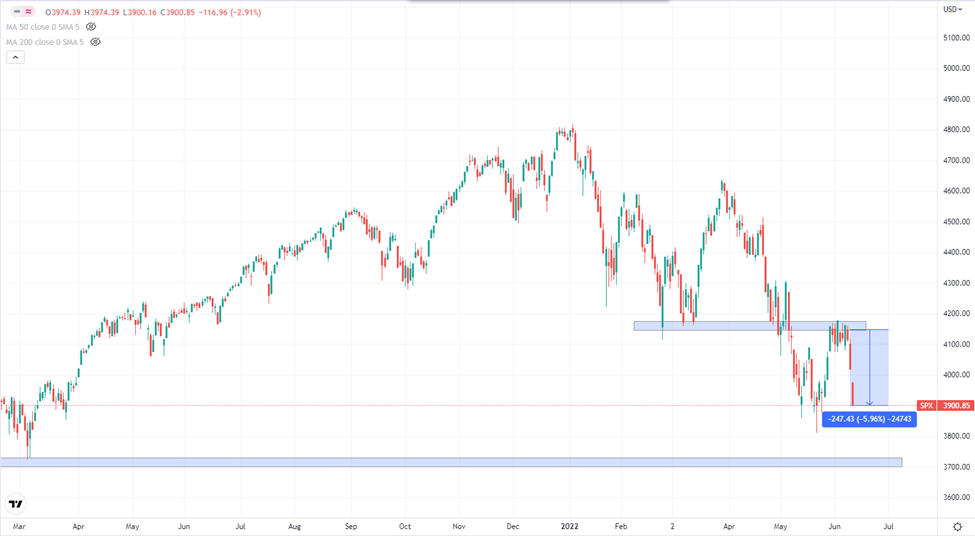
SP500 Daily Chart
Investors aren’t too optimistic about the inflationary numbers as reflected by the sell-off in SP500. The index fell nearly 6% in the past 3 trading days and the next strong support can be found at the 3700 key level. On the other hand, resistance is at 4150 where the price did a U-turn the last time it went there.
Cryptocurrencies

Bitcoin Daily Chart
Bitcoin has broken out from its month-long consolidation phase and is heading South. It has lost 16% in the past 4 days alone amid heightening inflation concerns. Revisiting the 18-months low definitely isn’t something that Bitcoin hodlers/ investors want to see. Other cryptocurrencies are not safe either as the bearish waves swept through the the crypto universe with Ethereum, Cardano and Solana shaved 30%, 28%, and 35% respectively.
Interest rates effect:
Canada and Australia have raised their interest rates last week to combat inflation, while ECB said it would begin rate hikes in the summer and stop purchasing assets. As the interest rates of different major currencies rise, the costs of holding other assets such as cryptocurrencies increase, further reducing the demand and subsequently the prices of these assets.
Let’s hope that the 23000 is able to provide support. If not, we are very interested in the 19000 area where Bitcoin made its significant all-time high.
Welf
Trader, Technical Analyst
________________________________________________________________________________________
Don’t miss out on BIG market moves!
Want to trade more than 300+ instruments with raw spreads starting from 0 pip and commissions as low as $2 per lot per side?
Sign up with FXPIG now!


