Economic calendar
Today- US CPI at 8:30 EST
Forex
USDJPY

USDJPY Daily Chart. Source: TradingView
The dollar continued to strengthen against the Yen due to interest rate differentials. BOJ still firm on its dovish stance, with analysts predicting that it will remain this way until the current BOJ governor, Kuroda’s term is over in the coming year. Trading just above 134.00, the pair is just one Yen, or 100 pips away from its 2 decades high, made back in 2002. We are expecting the pair to continue rising and test the mentioned 2 decades high. Next support is marked at 132.5, its previous swing low on the 4 hour chart.
Metals
Gold

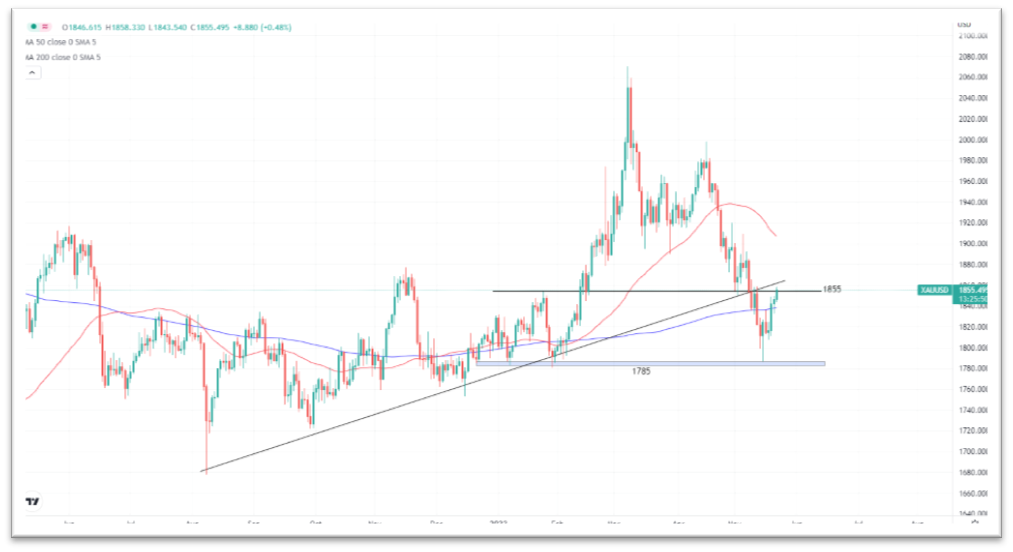
XAUUSD H4 Chart. Source: TradingView
Gold failed to make a higher high and is now trading below both the 50 and 200 moving averages on the 4-hour chart. Not only that, but the bulls also couldn’t win the tug of war in the 1855 decision area. The metal is positioned for a bearish move, but we should wait for the CPI numbers later today for a firmer direction. The inflation rate Year over Year is expected to stay the same as the previous’s reading while the core inflation (excluding food and energy prices) is expected to cool down by 0.1%.
Energies
Crude Oil
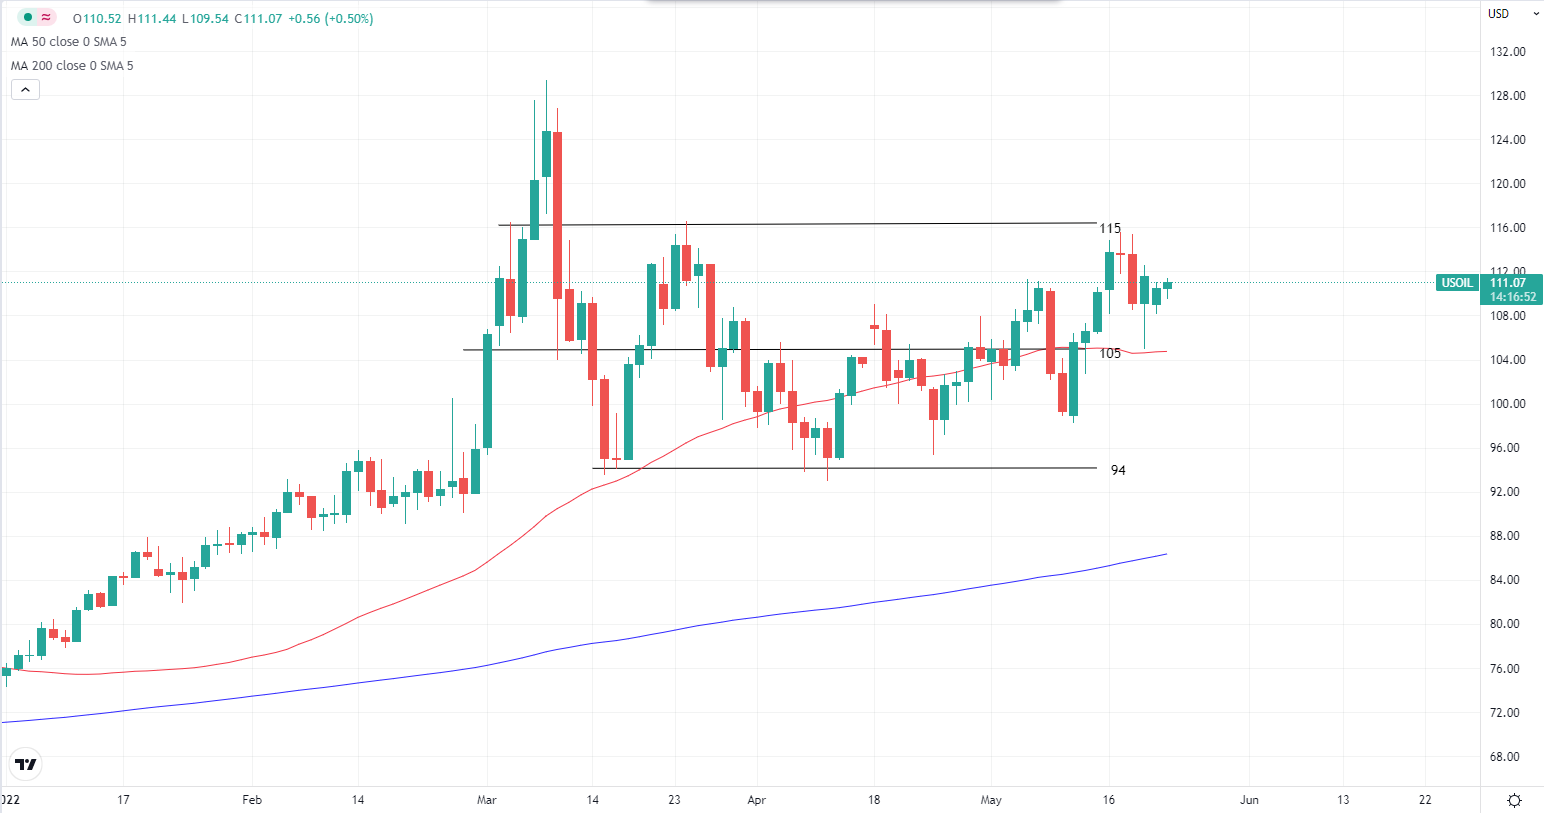
USOIL H4 Chart. Source: TradingView
Technical wise, crude oil steadies with higher lows and higher highs made over the week. The gasoline demand in the US has been increasing due to the start of the summer travel season, lockdowns in China began to ease and supplies remain tight, these are some of the main factors pushing the crude prices up. $129 recent highs are still in sight with the 50 moving average as the immediate support.
US Stocks
SP500
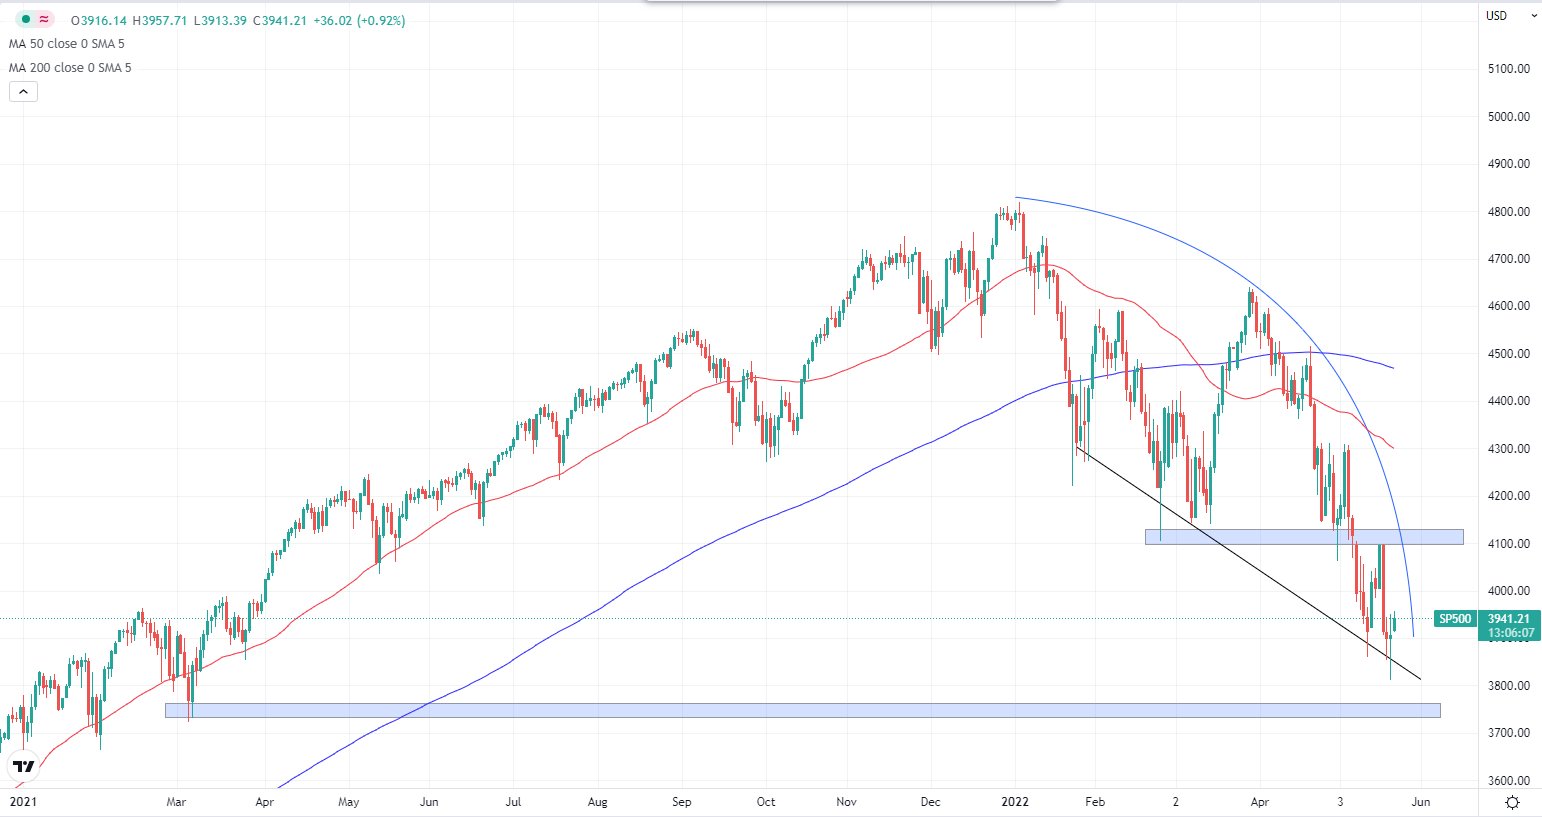
SP500 Daily Chart. Source: TradingView
After trading above the 4100 for a few days, SP500 couldn’t hold the level and it fell 2.27% during yesterday’s session. Could that be a lower high being made? We shall wait for the CPI report later as inflation is the main driver of investors’ sentiment in the stocks market now.
Cryptocurrencies
Bitcoin

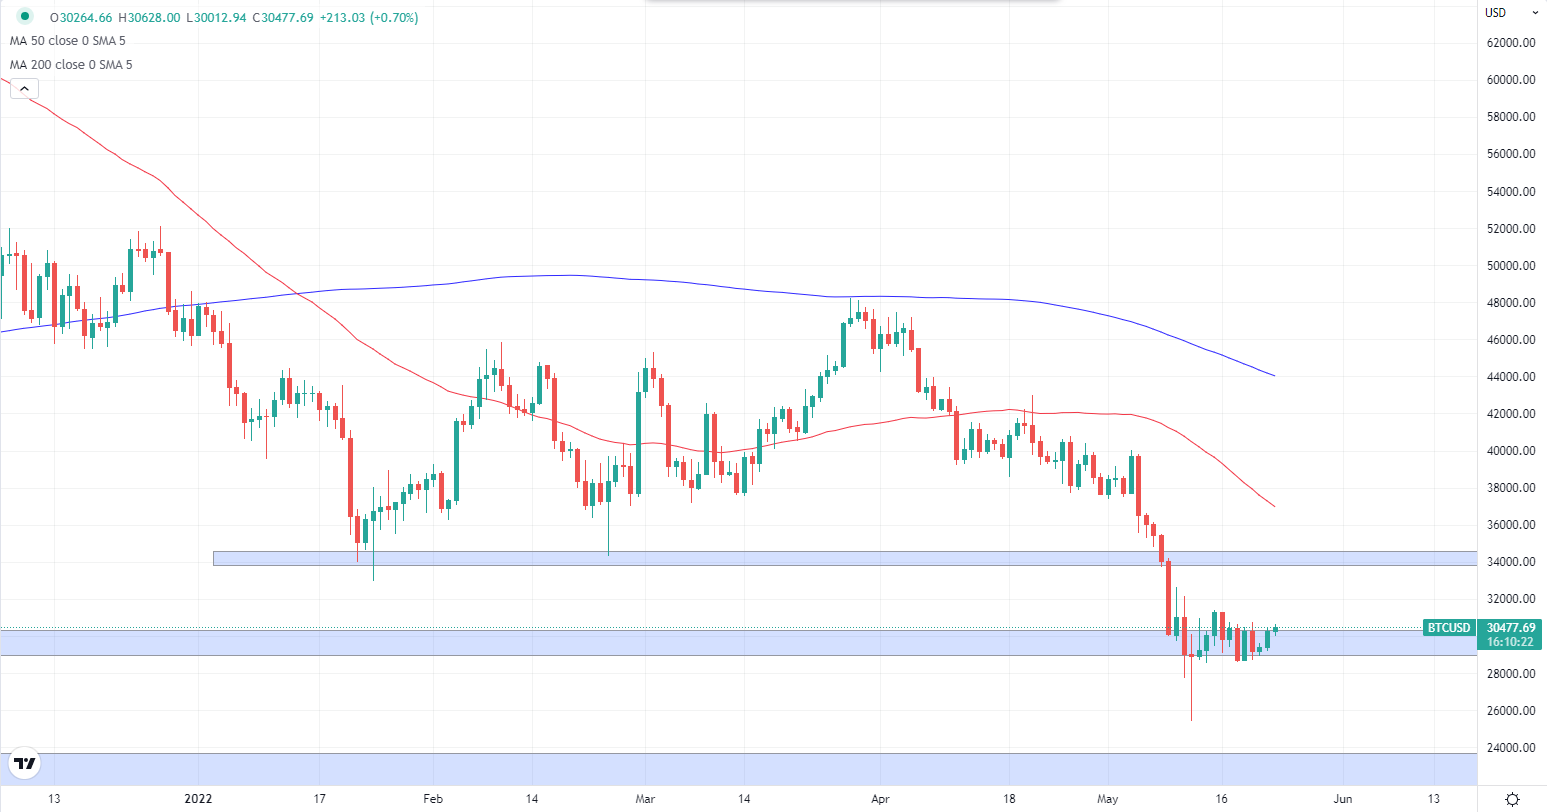
BTCUSD Daily. Source: TradingView
As capital fled away from risk assets due to global uncertainties, the trading volume of Bitcoin has diminished significantly. It has been consolidating for a whole 30 days and there looks to be no upcoming big market catalyst to move the cryptocurrency. For trend traders, we shall wait for a breakout.
Welf
Trader, Technical Analyst
________________________________________________________________________________________
Don’t miss out on BIG market moves!
Want to trade more than 300+ instruments with raw spreads starting from 0 pip and commissions as low as $2 per lot per side?
Sign up with FXPIG now!
Economic Calendar
Monday- Bank Holidays for Australia, New Zealand, Switzerland, France, and Germany
Tuesday- Cash Rate for AUD
Thursday- EUR monetary policy statement
Friday- US CPI
Forex
EURUSD

EURUSD Daily Chart
EURUSD’s retracement momentum has slowly faded with a 50 daily moving average applying bearish pressure. 1.0800 is the next resistance level where most traders look for short opportunities. Additionally, bank holidays in major economies will remove a lot of liquidity from the market.
NFP last Friday was relatively slow, and Economic Insight from Trading Central provides key information in a sleek-looking illustration.
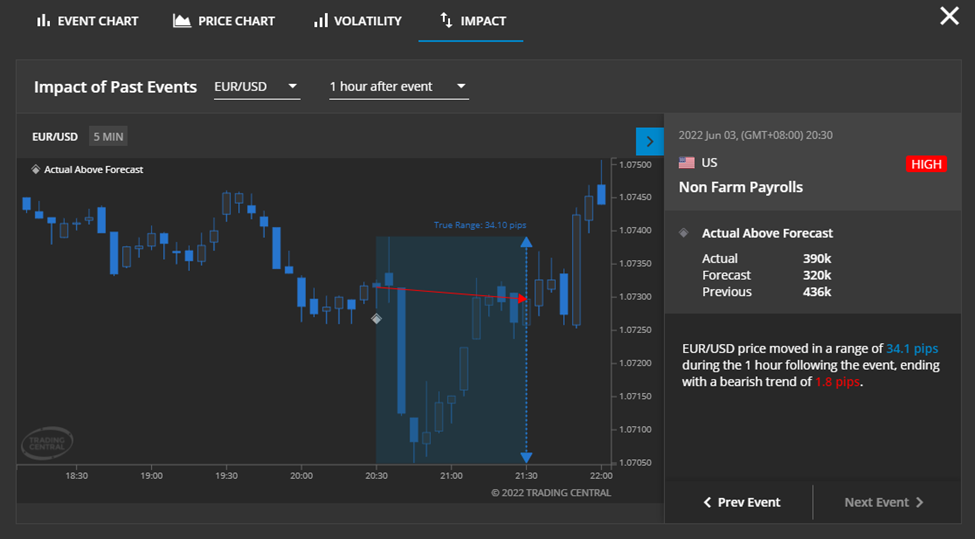
Trading Central: Economic Insight
From the chart, we can observe that EURUSD went down slightly and quickly bounced back up to end its one-hour movement just 1.8 pips below the opening price.
Precious Metals
Gold

XAUUSD Daily Chart
Most of the technical formation has not changed for gold since last Friday. Similar to EURUSD, we are expecting little movements on this metal today while everyone is getting set on US inflationary data. The broken trendline acts as immediate resistance while the 200 DMA supports gold from below.
Energies
Crude Oil

US Crude Daily Chart
Oil prices jumped last Friday to end the week at +4.57%. It could be attributed to the hike in crude price by Saudi Arabia starting with its July sales, at $6.50 premium. This move came after OPEC+ decided to accelerate their increase in output in the next months, which shows just how tight the current supply in the market is. We are definitely looking forward to crude oil hitting $129 previous highs if this continues.
US Stocks
SP500
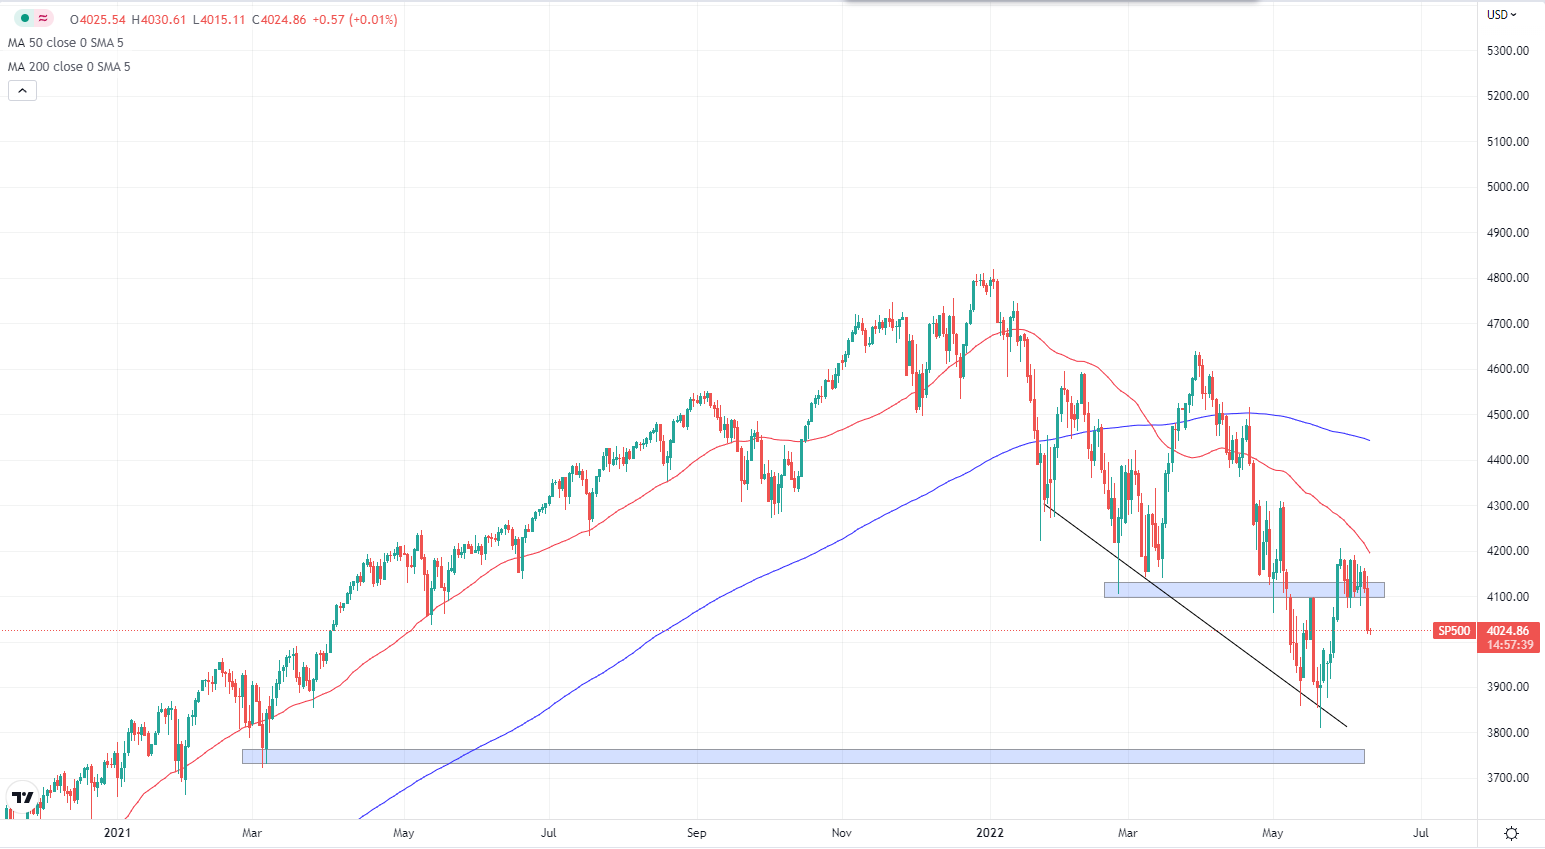
SP500 Daily Chart
After bouncing off from the bearish trendline, SP500 managed to stay and trade above 4100. The 50 DMA is the first test for the bulls should the stock markets is to rebound from its 1-year-low. CPI remains the key event for the US stocks market so trade cautiously while the market is setting up for the event.
Cryptocurrencies
Bitcoin

BTCUSD Daily Chart
Market-leading Bitcoin has been stuck in the 30000 area for almost a month now. There was some buying taking place as we saw a 4.76% gain since today’s morning. Still no significant movement to signal any potential trending move. 34000 together with the 50 Daily moving average remain the next resistance while 30000 is a tough support level to break through.
Welf
Trader, Technical Analyst
________________________________________________________________________________________
Don’t miss out on BIG market moves!
Want to trade more than 300+ instruments with raw spreads starting from 0 pip and commissions as low as $2 per lot per side?
Sign up with FXPIG now!
Economic calendar
- Bank holiday in the UK
- NFP
Interesting Trade Ideas
Apple’s to have the first death cross in 3 and a half years. Usually stock tumbles as the 50 moving average crosses over the 200 moving average to the downside on the daily timeframe. Fundamentals-wise, apple’s annual WWDC is happening in 3 days and that could add more trading volume and volatility to the stock.

NASDAQ: AAPL Daily Chart
The probability of this death cross playing out is relatively low due to WWDC as the announcement of new exciting stuff is more than likely to push stock prices higher.
$157 will be the first resistance and then there are the 2 moving averages standing in the way.
Before the News
XAUUSD

XAUUSD Daily Chart
Gold is still stuck in between the bullish trendline and 1855 support as we wait for the job print. The number is predicted to be 325k, compared to the previous reading of 428k. However, inflationary concerns and the Russian war still overshadow the jobs market currently.
If gold breaks and closes above the trendline, we may see gold continue to rise and subsequently test 1915, the next resistance level.
Energies
US Crude

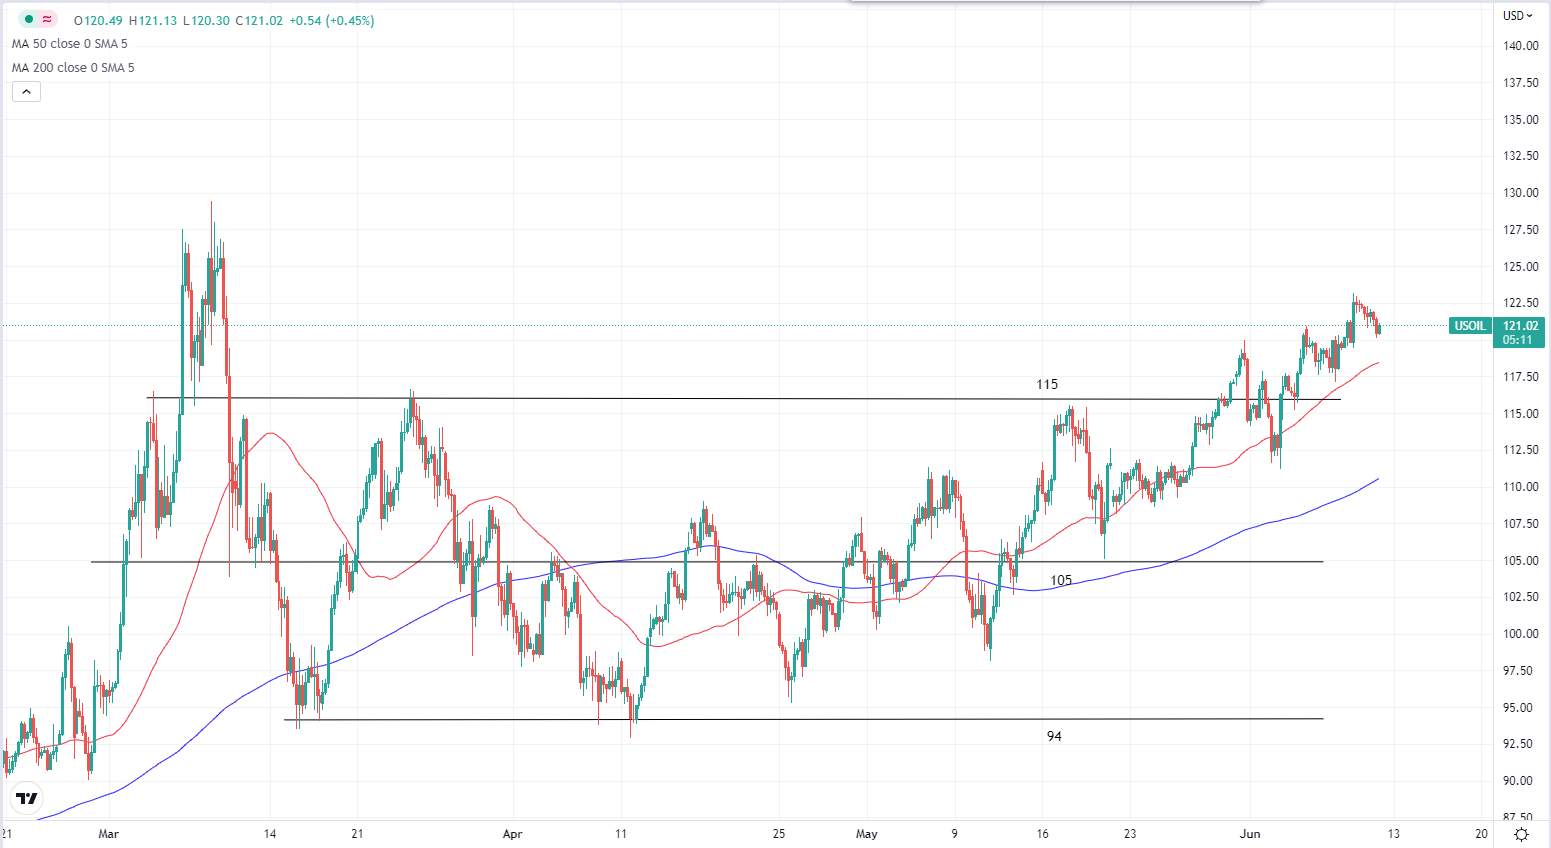
USOIL Daily Chart
Crude oil made a weekly high at $120 per barrel. Currently trading at 115.50, let’s see if it can end the week above the $115 key level as OPEC+ agreed to increase their production in the coming months. It is doubtful that the rise in production will ever be enough to cover the loss of Russian oil and when China’s slowly resuming its oil imports, the tightness in the oil markets is going to be reflected in its price. A test of its recent high at $129 is still on the table.
Welf
Trader, Technical Analyst
________________________________________________________________________________________
Don’t miss out on BIG market moves!
Want to trade more than 300+ instruments with raw spreads starting from 0 pip and commissions as low as $2 per lot per side?
Sign up with FXPIG now!
Economic Calendar
Important Events This Week
Monday- USD Bank Holiday
Wednesday- CAD interest rates
Thursday- GBP, EUR Bank Holiday, ADP Non-Farm Employment Change
Friday- GBP Bank Holiday, NFP
Covid in China
China recorded less than 100 new cases yesterday. Lockdowns may soon be lifted, manufacturing and consumption will be ramped up and global supply chains may not be as tight as it is right now. China’s oil demand will resume and it is good news for oil producers,
Forex
EURUSD
EURUSD Daily Chart
Not much has happened since last Friday. Markets are still slow while we are waiting for the Europe session to begin. Also, note that it is a US Bank holiday so the price may not move much. 50 Daily Moving Average is still keeping the bulls in check, with 1.0800 as its backup. We usually do not trade during bank holidays because volumes are thin, it is better to take a break and sit on the sideline.
Metals
XAUUSD

XAUUSD Daily Chart
Gold is still lingering between the broken trendline and the 200 DMA after ending the previous week with mild gains of 0.36%. As the USD is undergoing a correction phase, gold may continue rising with the 50 DMA acting as a powerful resistance, coinciding with the 1900 key level.
Energies
Crude Oil

USOIL H4 Chart
Crude rallied and set for a positive start for the week.
Factors contributing to the rise include but not limited to:
EU is holding a meeting Monday and Tuesday to discuss a ban on Russian import
- China’s covid related restrictions will be lifted sooner or later as their new daily cases dropped to double-digit
- USD is undergoing a correction, which means it is cheaper for oil importers holding other currencies
In terms of technicals, the price is testing the $115 upper barrier and the likelihood of it breaking is very high. If it breaks, crude may test the previous decade-high at $129.
US Stocks
SP500
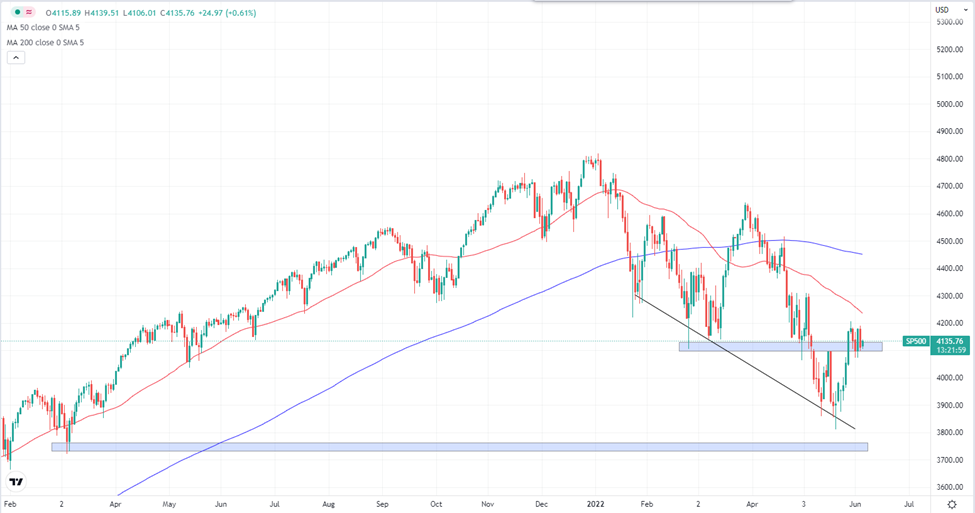
SP500 Daily Chart
Investors breathe a sigh of relief as the stocks market finally closed the week in green after 7 consecutive losing weeks. It broke and closed above 4100 resistance which is a good sign that it may extend the rebound. However, the 50 DMA will be met shortly, coinciding with 4300 level. Inflationary concerns remain although the previous print was showing improvements. The Fed is expected to continue the rate hike all throughout this year which may weigh on the current bullish momentum.
Cryptocurrencies
Bitcoin

BTCUSD Daily Chart
Bitcoin closed the previous week in loss, adding to its 8-week losing streak (Suprise, this is the longest losing streak that Bitcoin has ever been in). Nothing much happened over the weekend and Bitcoin is still consolidating between $28000 and $32000. Looking at the overall technical picture, we make a brave prediction that the bearish momentum may continue and Bitcoin is going down to test $19500 (its first all-time high made back in 2017).
Welf
Trader, Technical Analyst
________________________________________________________________________________________________________________
Don’t miss out on BIG market moves!
Want to trade more than 300+ instruments with raw spreads starting from 0 pip and commissions as low as $2 per lot per side?
Sign up with FXPIG now!
Economic calendar
Wednesday – New Zealand official cash rate/ FOMC meeting minutes
Forex
EURUSD
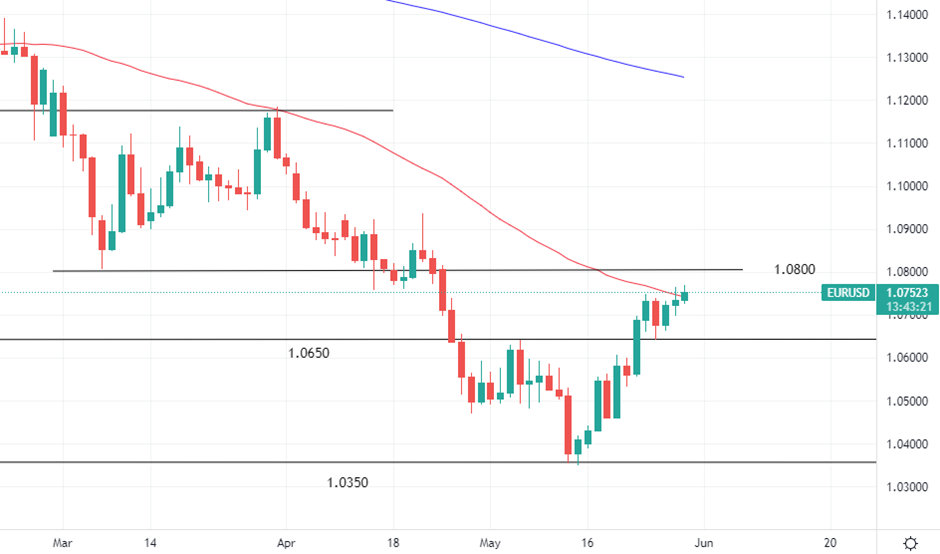
EURUSD Daily Chart
The Euro strengthened against the greenback over the past 10 days and is just dancing on the 1.0600 level as we speak. 1.0650 will act as the immediate resistance standing in the way of the bulls while the 50 Moving average will be the next layer of resistance to the upside.
Gold
XAUUSD
XAUUSD Daily Chart
Gold climbed steadily last week after bouncing from 1785 support and is currently testing the 1855 trendline and resistance level. The rise could be due to the USD having a slight pullback in strength as we witnessed on the EURUSD also. If it breaks above the trendline again, we could see the bullish momentum resumes, although it is not as lucrative to hold gold considering the rising interest rates.
Energies
USOIL
USOIL Daily Chart
Crude oil was trading consistently in the upper half of its trading range with the 50 daily moving average acting as support. The driving season is also about to begin in the US, which is the peak season for oil demand. Shanghai is also due to reopen its city on June 1st. The outlook for crude oil remains bullish as demand is resuming sooner or later while supply is still tight. 115 will be the first resistance to break through and we will see from there.
Stocks
SP500
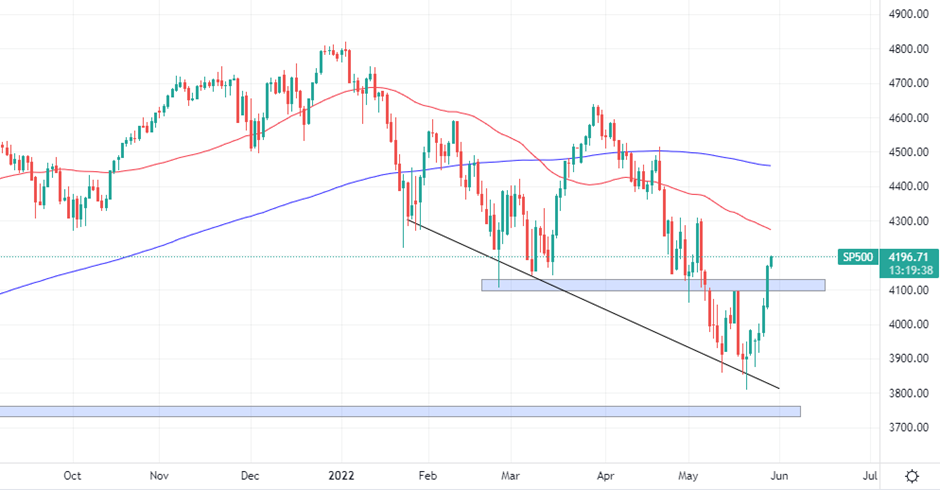
SP500 Daily Chart
From a technical standpoint, SP500 has been making lower highs and lower lows, Considering the rate of decline has been increasing ( the slope of the downfall has become steeper ), the next possible target could be 3750.
Cryptocurrencies
BTCUSD

BTCUSD Daily Chart
Bitcoin has been stuck in a tight range at around 30000 key areas for quite some time now. We are still waiting for the next market catalyst and there is no directional bias for now.
Don’t miss out on BIG market moves!
Sign up for an account at FXPIG now to trade more than 300 instruments, including 60+ Crypto CFDs, 24/7 with spreads as low as 1 cent!
Economic calendar
Wednesday – New Zealand official cash rate/ FOMC meeting minutes
Forex
EURUSD

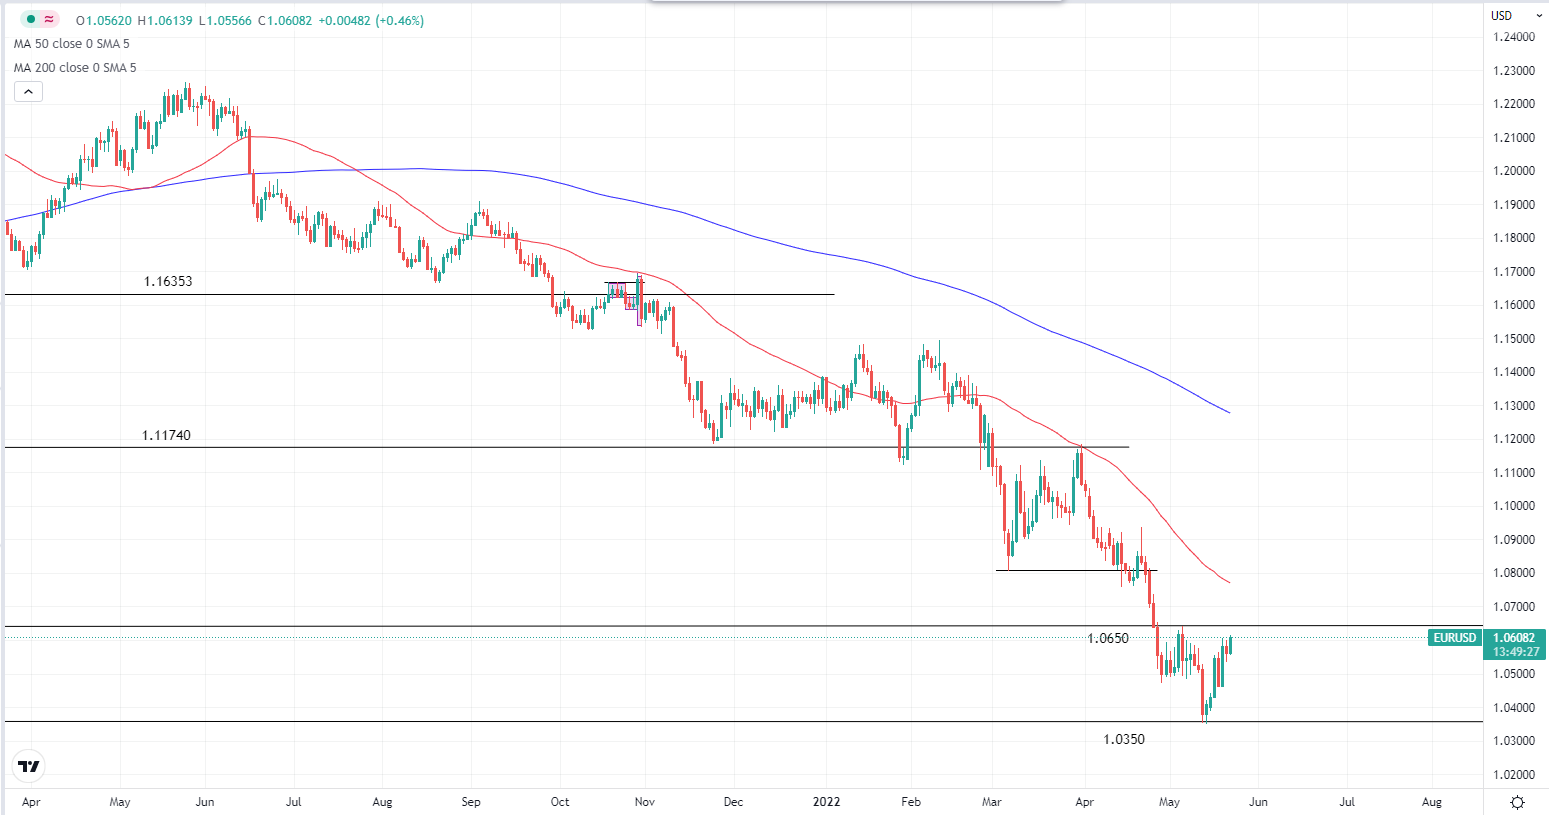
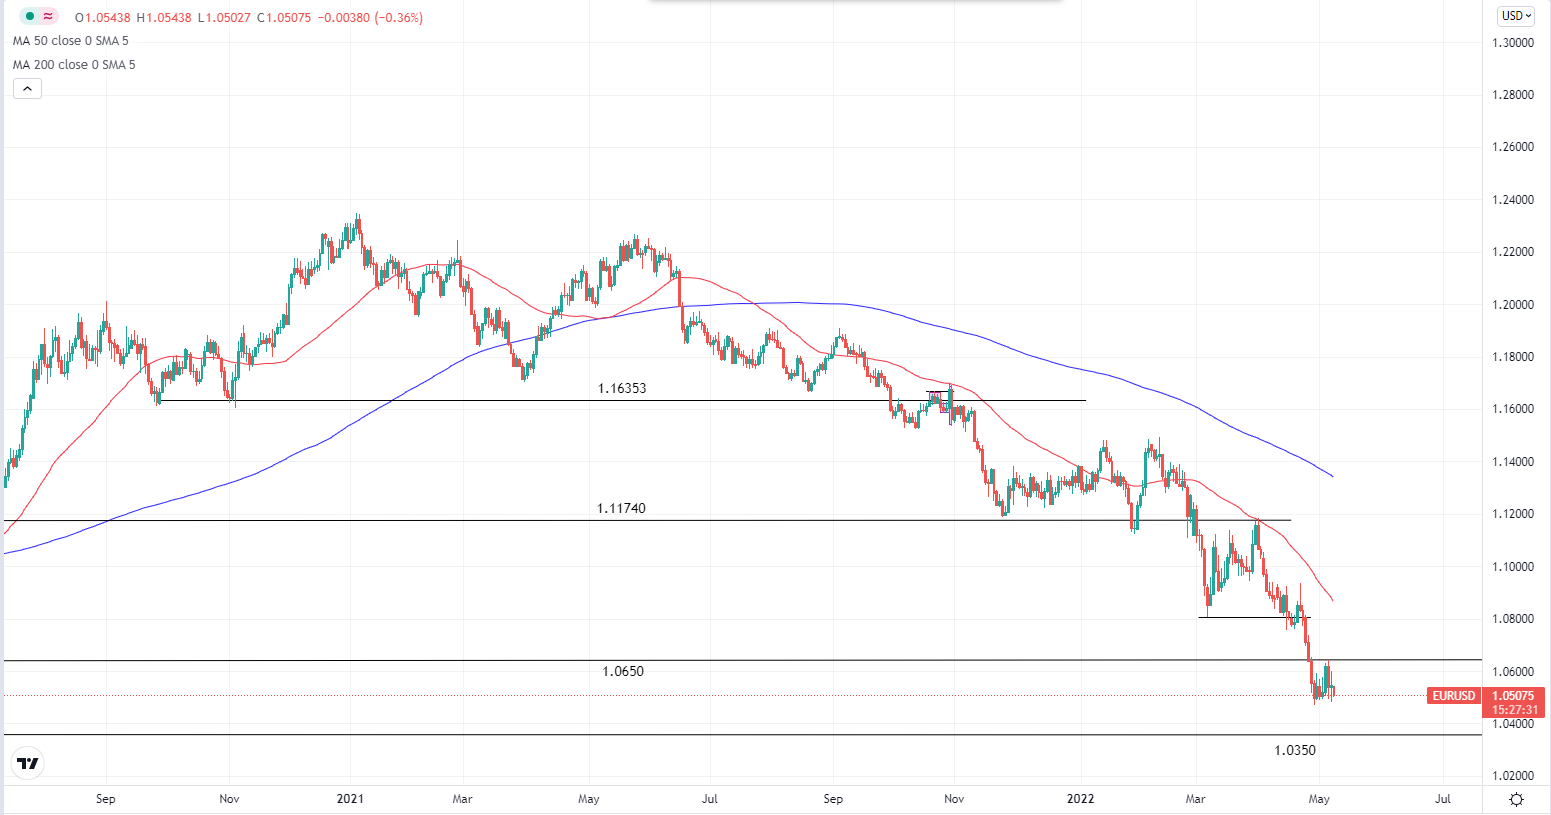
EURUSD Daily Chart. Source: TradingView
The Euro strengthened against the greenback over the past 10 days and is just dancing on the 1.0600 level as we speak. 1.0650 will act as the immediate resistance standing in the way of the bulls while the 50 Moving average will be the next layer of resistance to the upside.
Gold
XAUUSD
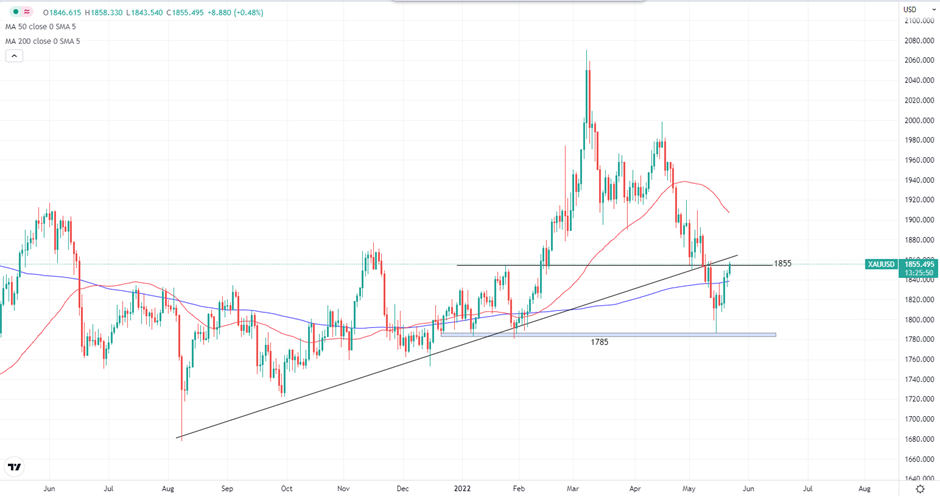
XAUUSD Daily Chart. Source: TradingView
Gold climbed steadily last week after bouncing from 1785 support and is currently testing the 1855 trendline and resistance level. The rise could be due to the USD having a slight pullback in strength as we witnessed on the EURUSD also. If it breaks above the trendline again, we could see the bullish momentum resumes, although it is not as lucrative to hold gold considering the rising interest rates.
Energies
USOIL

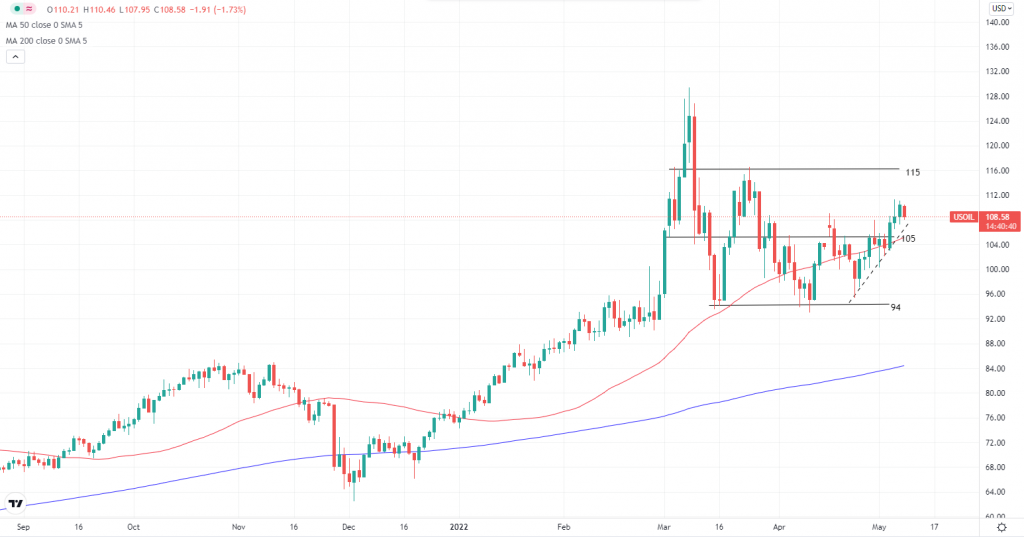
USOIL Daily Chart. Source: TradingView
Crude oil was trading consistently in the upper half of its trading range with the 50 daily moving average acting as support. The driving season is also about to begin in the US, which is the peak season for oil demand. Shanghai is also due to reopen its city on June 1st. The outlook for crude oil remains bullish as demand is resuming sooner or later while supply is still tight. 115 will be the first resistance to break through and we will see from there.
Stocks
SP500

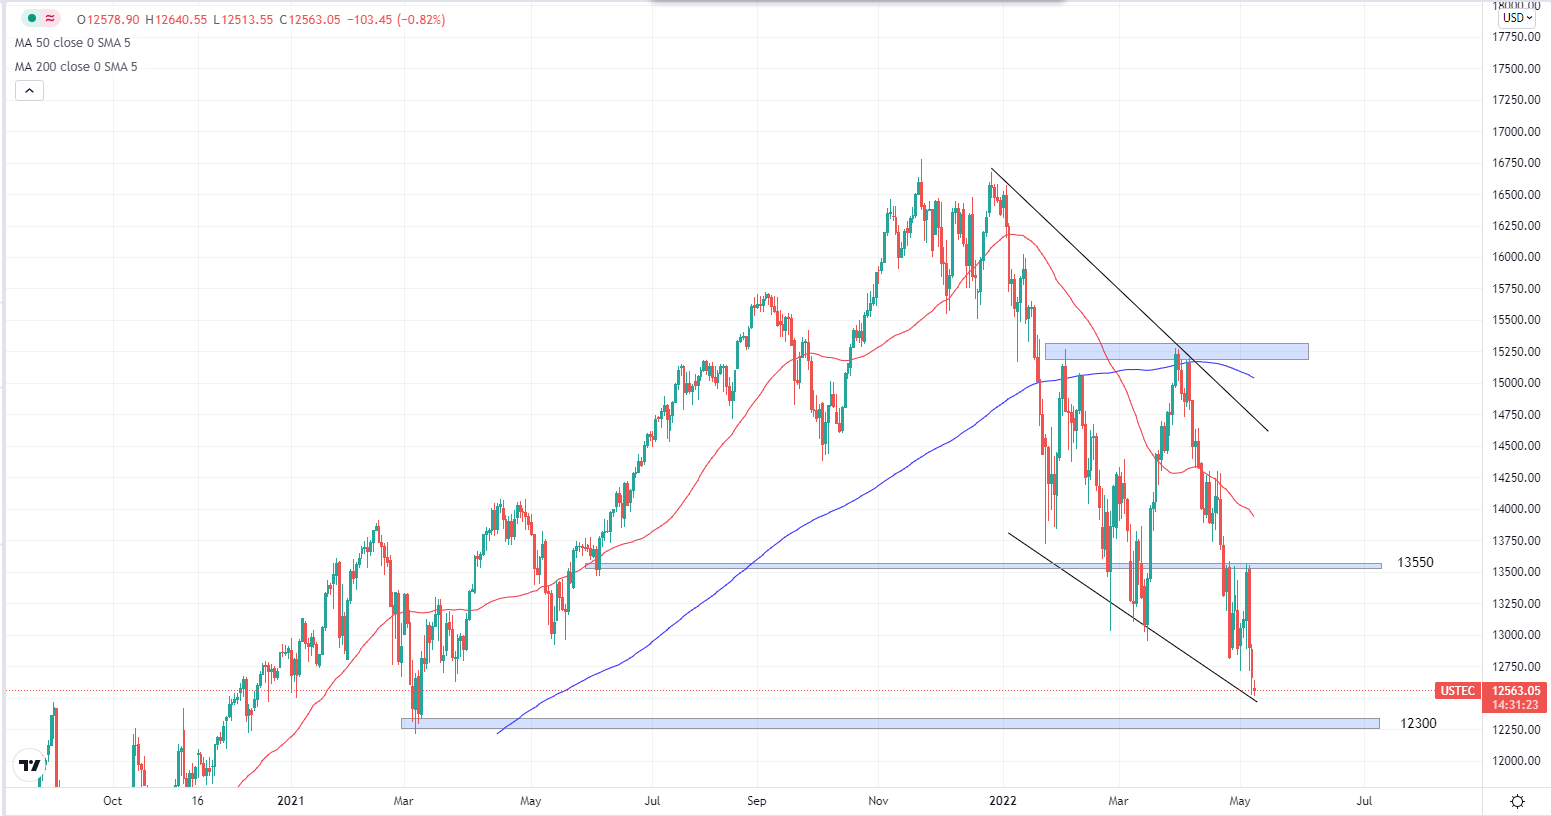
SP500 Daily Chart. Source: TradingView
From a technical standpoint, SP500 has been making lower highs and lower lows, Considering the rate of decline has been increasing ( the slope of the downfall has become steeper ), the next possible target could be 3750.
Cryptocurrencies
BTCUSD
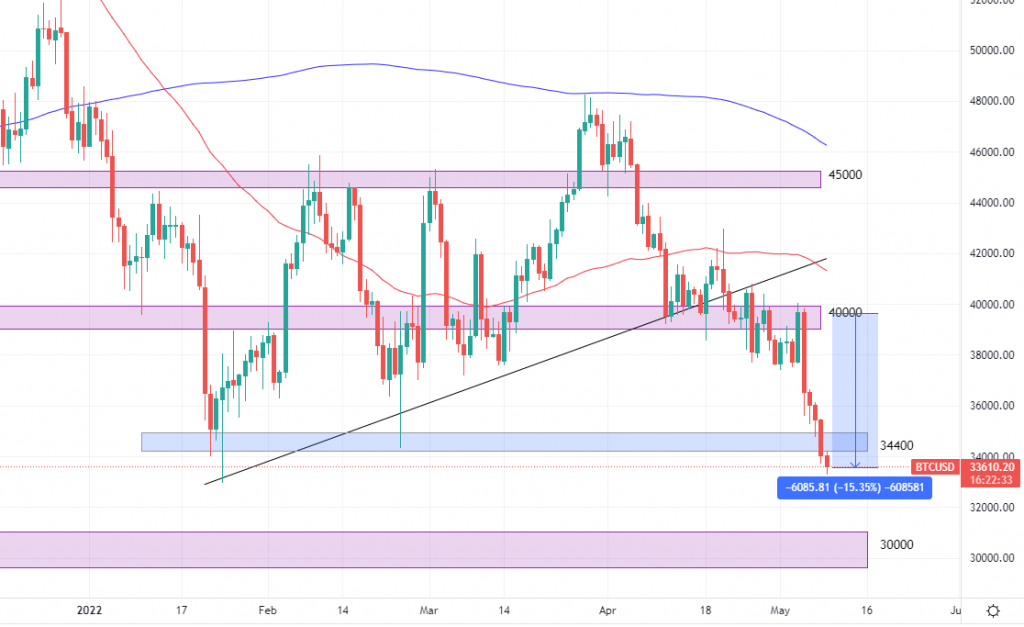
BTCUSD Daily Chart. Source: TradingView
Bitcoin has been stuck in a tight range at around 30000 key areas for quite some time now. We are still waiting for the next market catalyst and there is no directional bias for now.
Welf
Trader, Technical Analyst
Don’t miss out on BIG market moves!
Sign up for an account at FXPIG now to trade more than 300 instruments, including 60+ Crypto CFDs, 24/7 with spreads as low as 1 cent!
Economic Calendar
Monday- UK Monetary Policy Report Hearing
Wednesday- Fed Chair Powell speaks, UK CPI, Canadian CPI
Saturday- Australia election
EURUSD
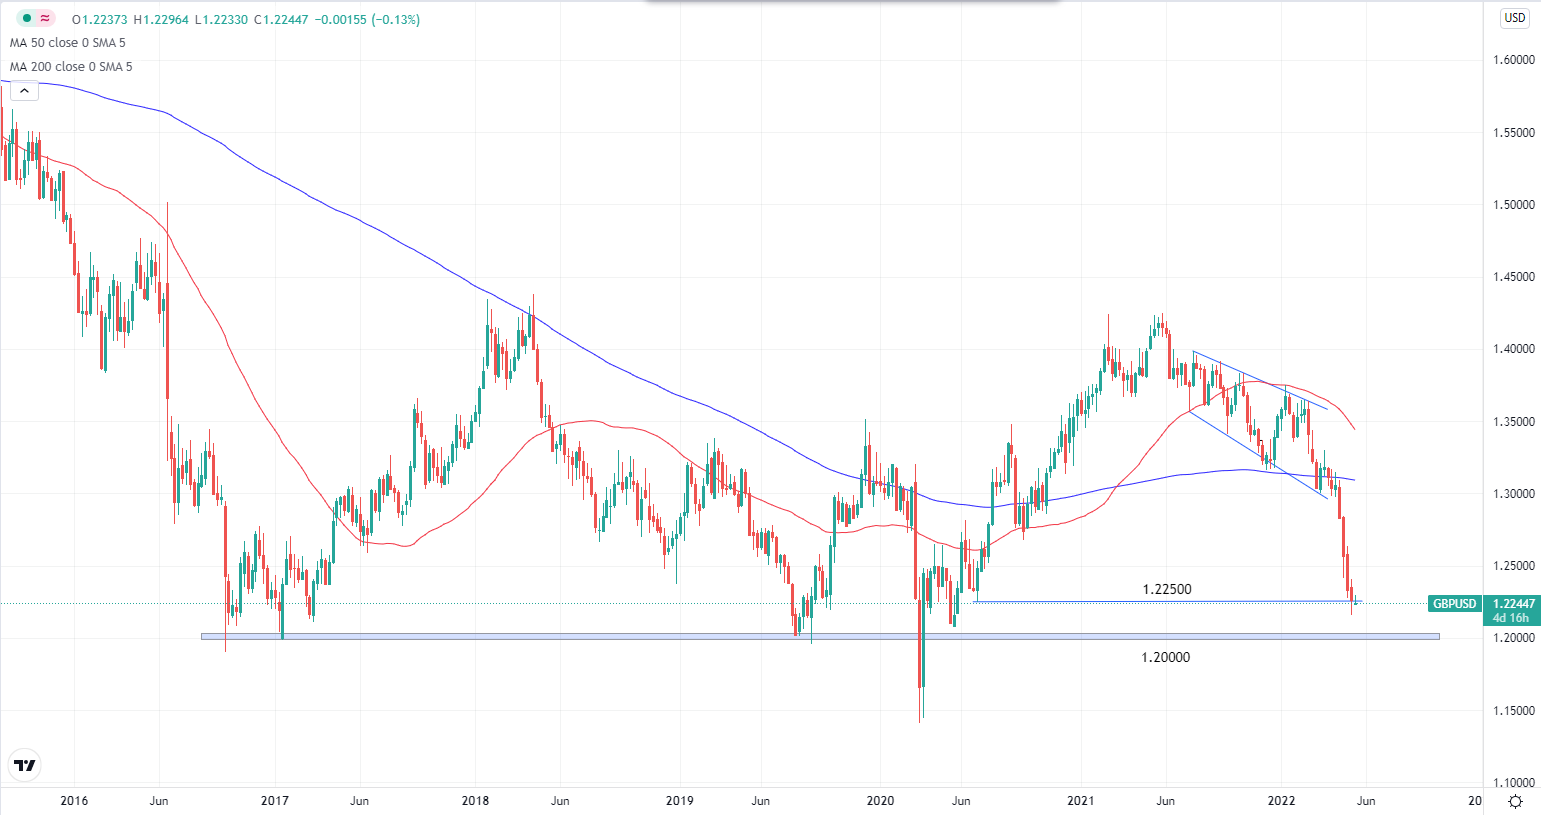
EURUSD Weekly Chart. Source: TradingView
If we take a step back and look at the weekly chart on EURUSD, we can see that parity is not so far away. It is currently just sitting on 1.0350 support and if it breaks, there is not much support for the Euro. If Euro continues to depreciate against the dollar at the same rate during the past 3 months, we can expect the pair to reach parity in 2 to 3 weeks’ time
Metals
XAUUSD
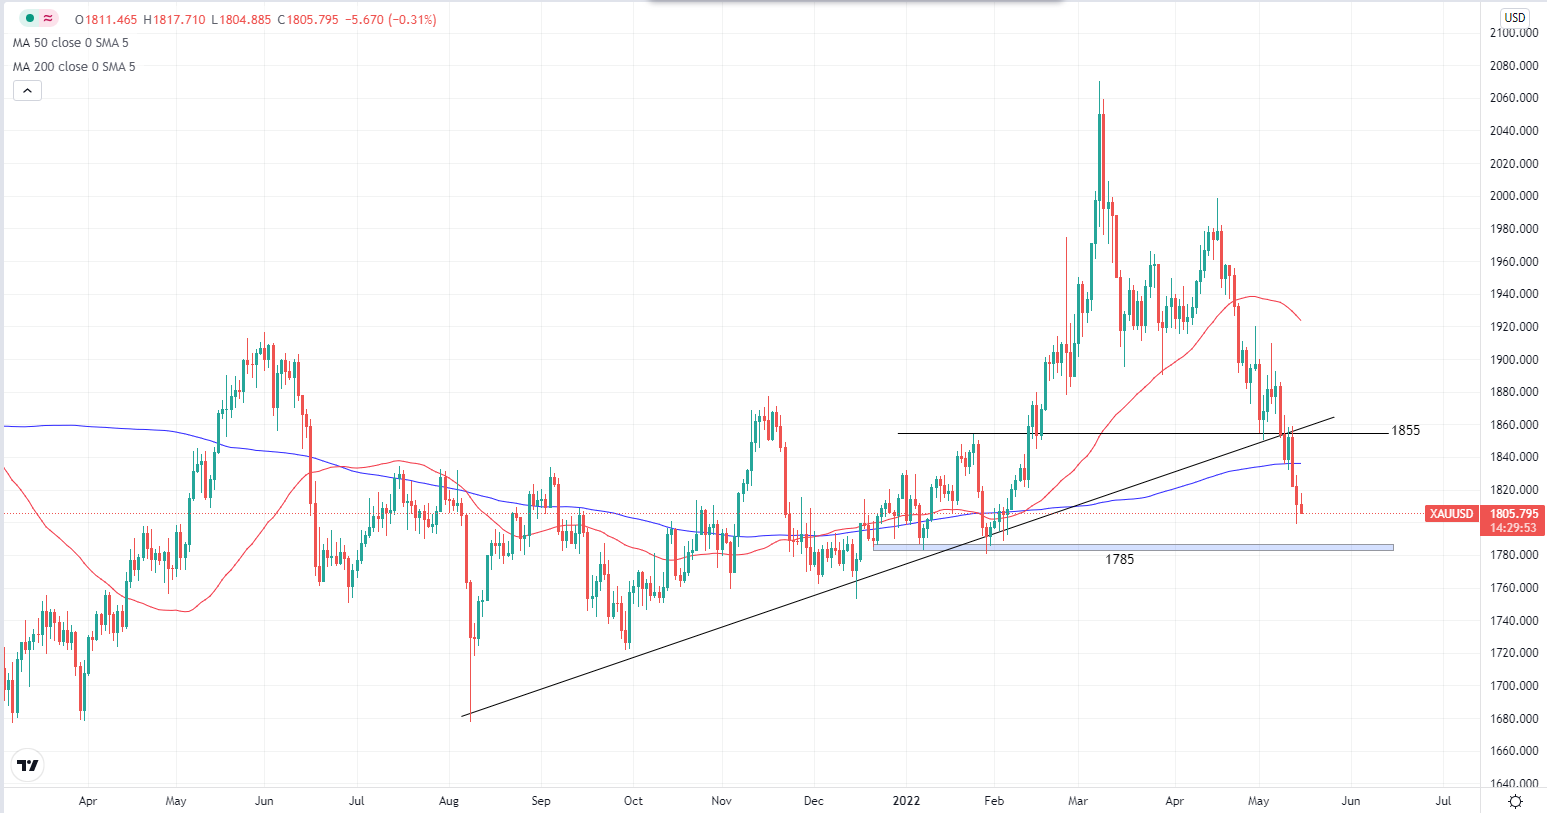
XAUUSD Daily Chart. Source: TradingView
Gold has broken below the 1800 key level and it is approaching 1785 at an aggressive pace. 1785 might be the last major support before it enters a free fall area, until 1680 at the lower end of the range. The fall in gold price may be primarily due to rising interest rates, and the increased opportunity cost to hold gold instead of other higher-yielding assets.
Energies
Crude Oil
Crude Oil Daily Chart. Source: TradingView
Crude oil continued to rise and ended the previous week at almost breakeven. Trading above the $105 pivot and 50 daily moving average acting as dynamic support, it is more likely for Crude oil to rise more, with the next immediate target at $115.
Cryptocurrency
BTCUSD
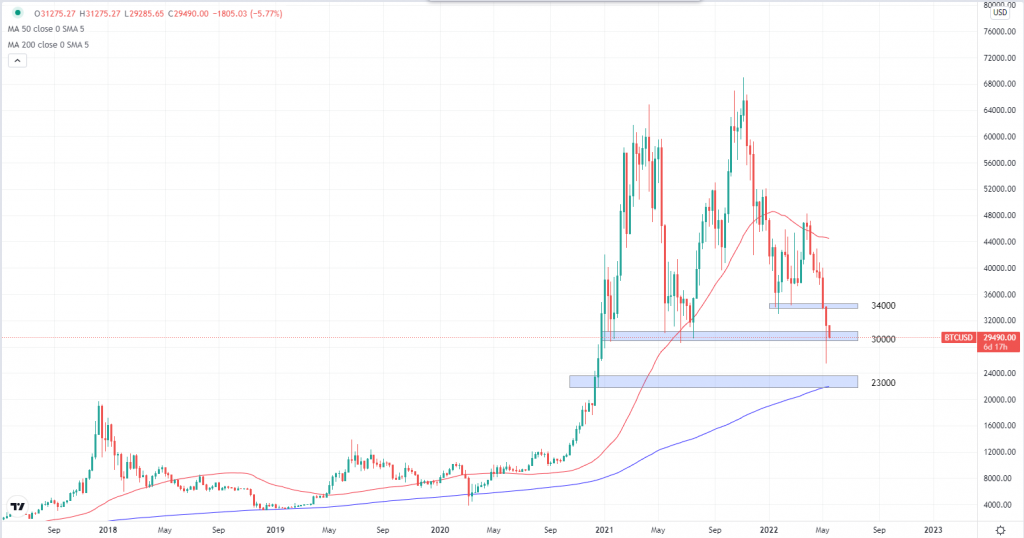
BTCUSD Weekly Chart. Source: TradingView
The largest cryptocurrency by market capitalization, Bitcoin, is starting the week in the red. It is currently down 5.7%, trading just below $30000. Capital is fleeing from risk assets like Bitcoin because of global uncertainties including inflationary concerns, China’s covid situation, and Ukraine Russia war just to name a few. Bitcoin is also following a similar path with a significant positive correlation to traditional stocks, losing its appeal as a means for portfolio diversification.
Stocks Markets
SP500

SP500 Daily Chart. Source: TradingView
There was a slight recovery during last Friday’s trading, but it couldn’t close past 4050 resistance. If there is a continuation to the downside, which is more likely the case considering the solid bearish momentum since April, we are looking at 3860 being broken and SP500 heading straight to 3750.
Welf
Trader, Technical Analyst
Don’t miss out on BIG market moves!
Sign up for an account at FXPIG now to trade more than 300 instruments, including 60+ Crypto CFDs, 24/7 with spreads as low as 1 cent!
There are no important economic events to end the week, however, volatility remains high across the market with participants continuously monitoring global macroeconomic developments, from the ongoing Russian war, China’s lockdown, EU’s oil embargo to the buffed-up USD and the most recent crash in Luna and Terra.
XAUUSD

XAUUSD H4 Chart. Source: TradingView
Gold is now down to its pre-war levels, trading at $1820ish after breaking through two recent support levels with ease. While gold is traditionally negatively correlated with the stocks market, they have been moving in tandem with each other for the past 2 months.
If the price continues to breach the current support, we may be looking at 1790 areas for a potential rebound.
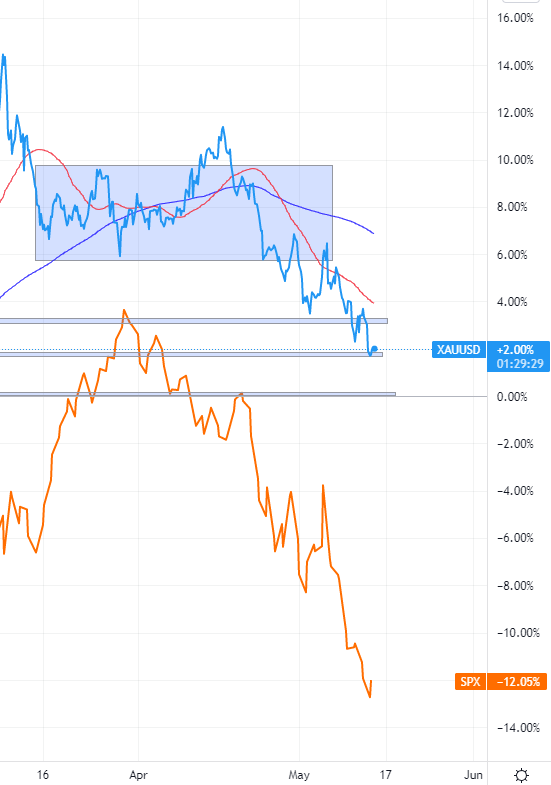
Image: Movement of XAUUSD relatively to SP500 (March 15 – May 13)
Source: TradingView
EURUSD

EURUSD Daily Chart. Source: TradingView
Trading at a 5-year-low, the Euro is at its weakest against the US dollar. It is trading at the 1.04 key level right now, and we are just waiting on the sidelines and see if the support holds. It is a Friday, so a significant breakout might be less likely, also there are no significant economic releases to give the price a solid push.
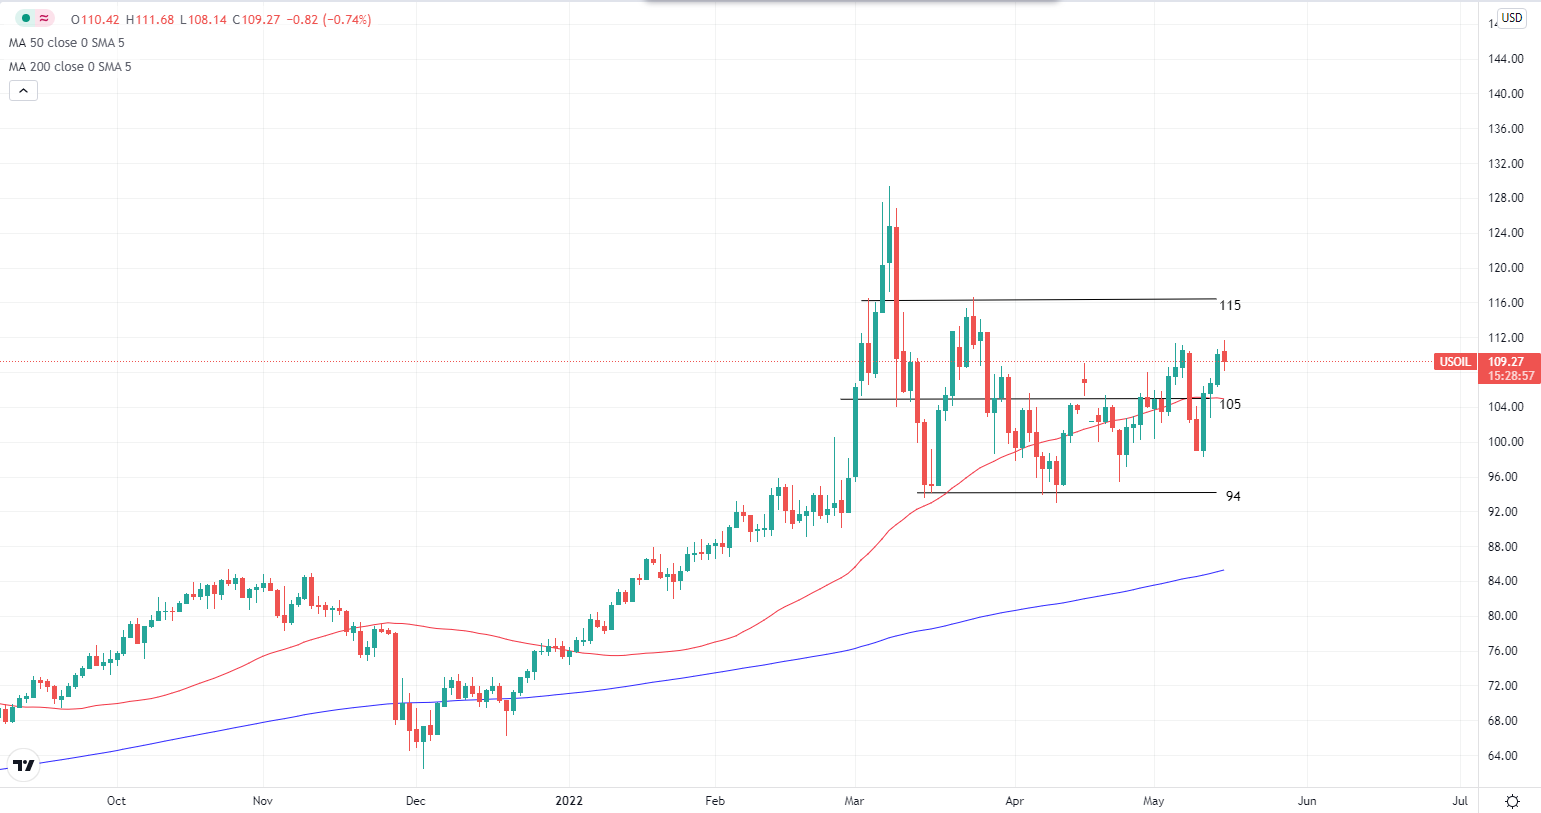
Crude Oil
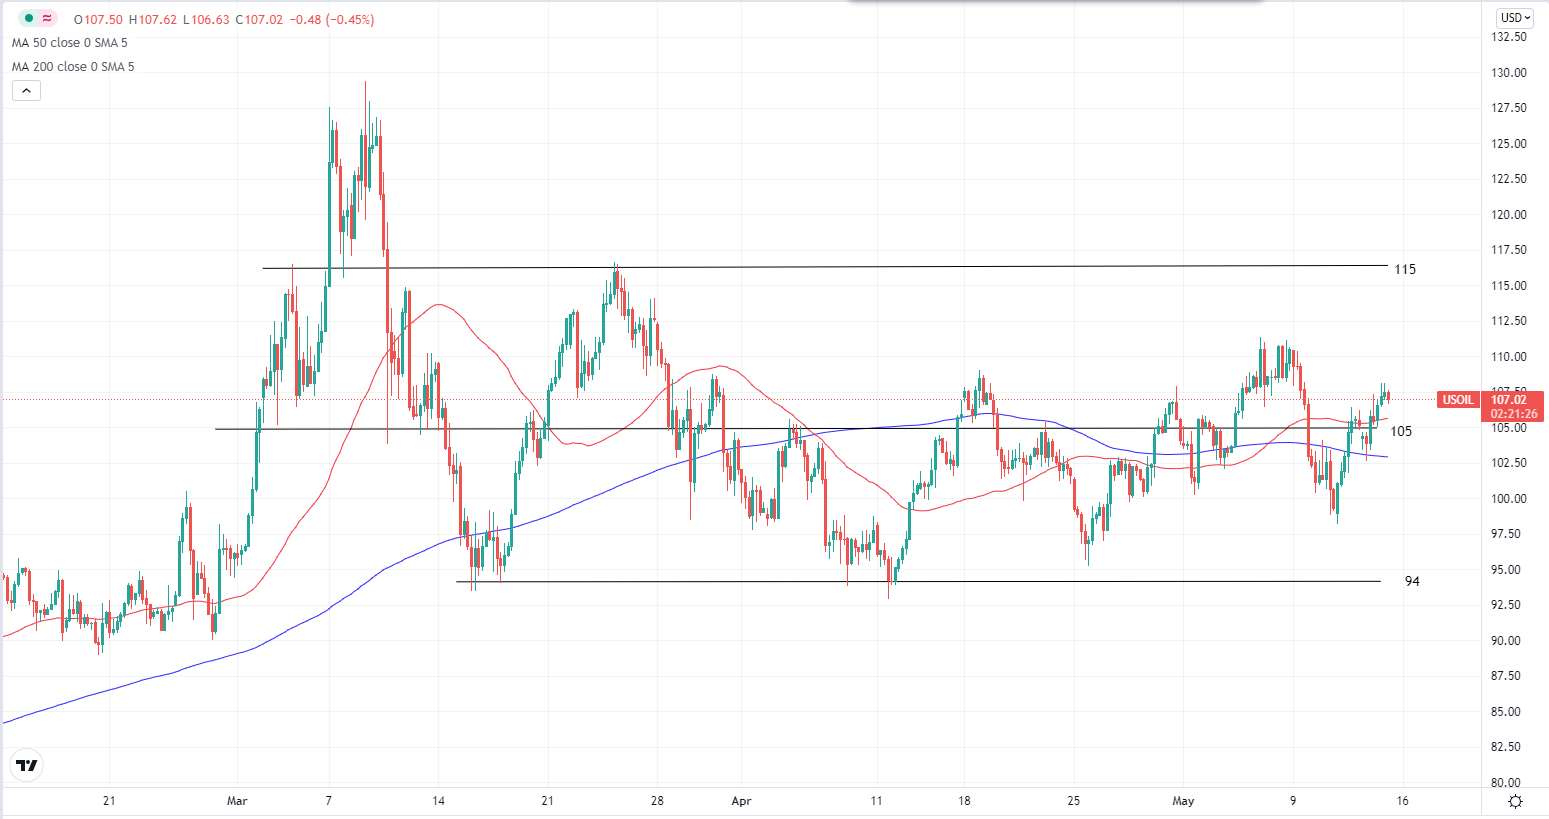
USOIL H4 Chart. Source: TradingView
Oil is trading back above its range’s midpoint, above $105 per barrel. It is pretty much range-bound right now where supply concerns caused by war and an impending embargo are offset by reduced demand from the major oil importer- China due to its lockdown. We need to see oil prices break above $105 to signal a continuation of the bull market, and a break below $94 for further downside. However, the former is more likely to happen as lockdowns related factors can be solved more easily than a limited global oil supply.
Nasdaq
Nasdaq Daily Chart. Source: TradingView
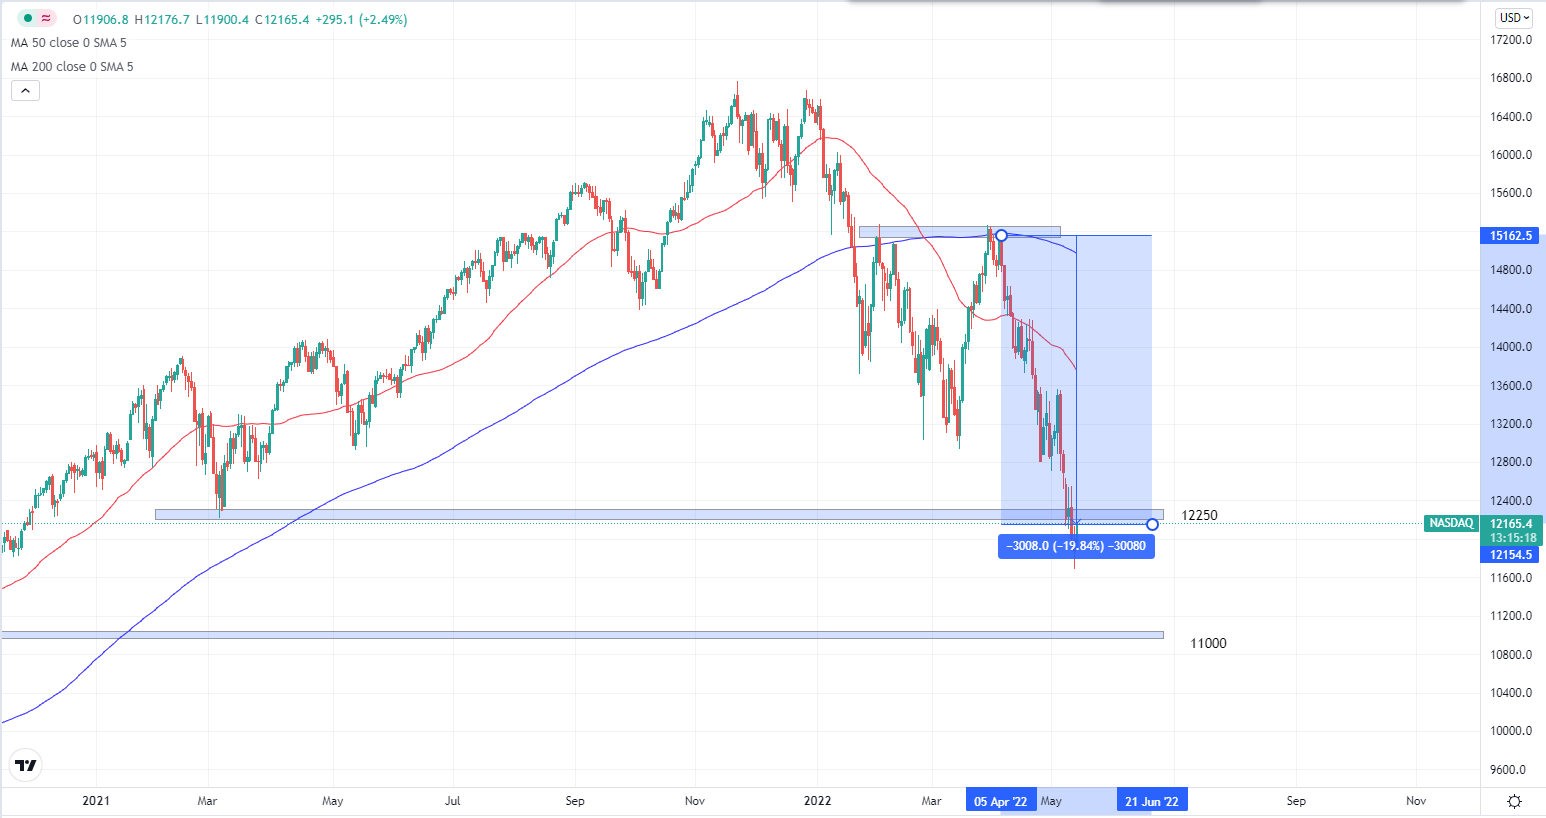
Tech-heavy Nasdaq composite index has seen a major retracement, losing almost one-fifth of its value in its most recent downswing.
It has also broken through key support at 12250, and if we see bears continue to be in control, 11000 will be our next target level. Most of this bearish momentum was most likely caused by inflationary concerns and the implementation of tight monetary policy by the Fed.
Cryptocurrencies
BTCUSD

BTCUSD Weekly Chart. Source: TradingView
We have witnessed a bloodbath across the crypto market in the past few days.
If we look at Bitcoin’s weekly chart, it lost as much as 45% of its value, although it has made some recovery. The main reason for the most recent sell-off is because Luna. one of its biggest buyers, has been forced to sell their Bitcoin holdings to support the Peg on UST, a stablecoin on the Terra blockchain.
SOLANA
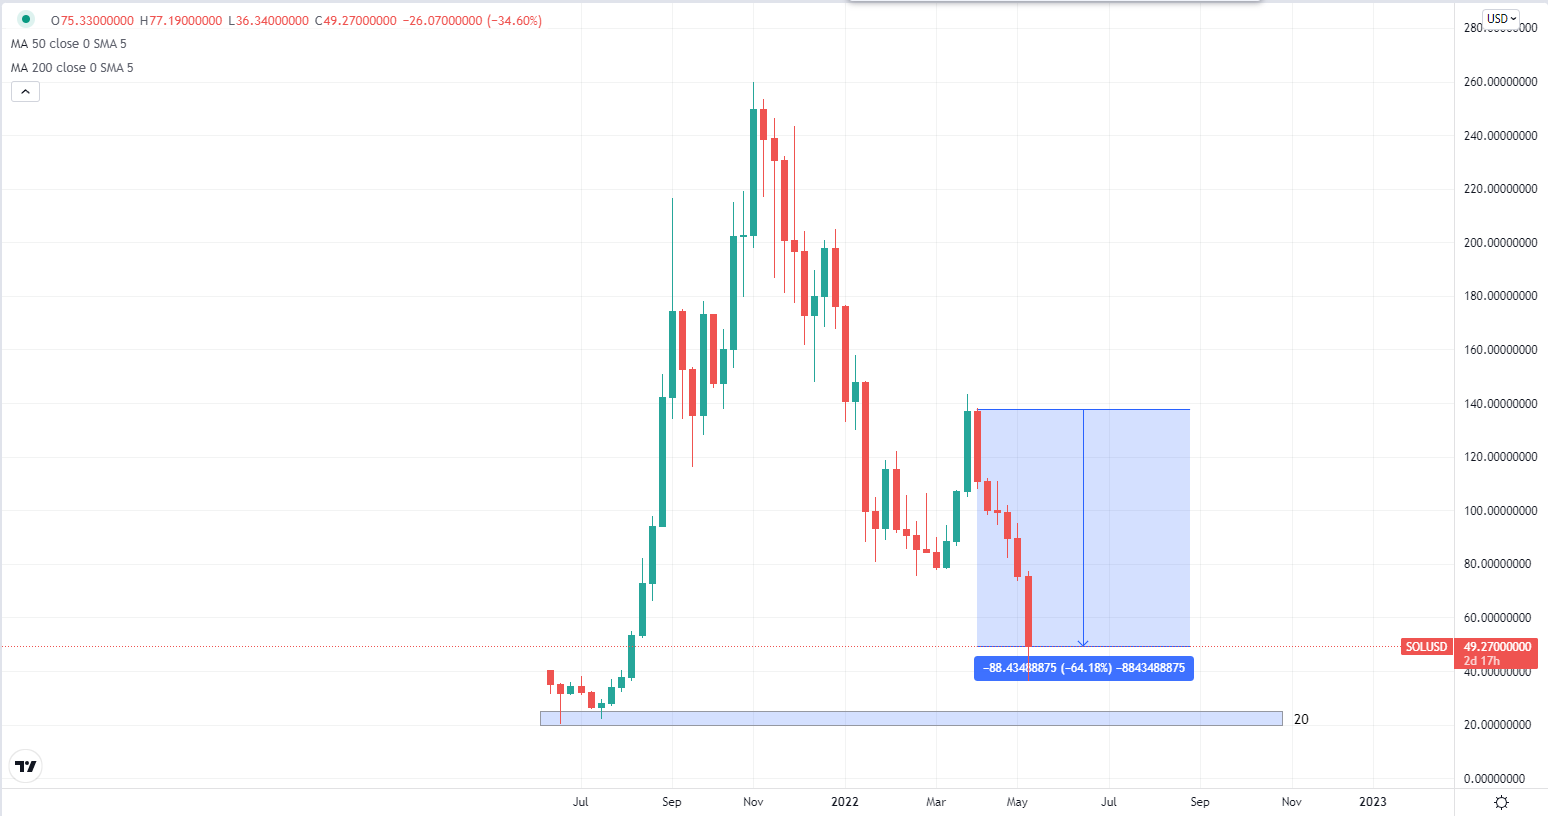
SOLANA Weekly Chart. Source: TradingView
Solana is one of the biggest losers in the recent crypto market sell-off with 64% of its value lost in the past month and a half. Our team of analysts has mapped out a potential zone to buy the dip at the $20 level. It is the price where Solana was first listed on major exchanges, and it could be a good bargain and a great chance to get your hands on some Solanas.
Welf
Trader, Technical Analyst
Don’t miss out on BIG market moves!
Sign up for an account at FXPIG now to trade more than 300 instruments, including 60+ Crypto CFDs, 24/7 with spreads as low as 1 cent!
Economic calendar
Wednesday– OPEC meeting, USD CPI
Thursday– USD PPI
The main economic event for the week will be the US inflation data, coming out at 8:30 AM EST on Wednesday.

According to Trading Central’s Economic Insight, the Core inflation is expected to slow down to 6.2% versus the previous print of 6.5%, easing inflationary concerns as the Fed continues to raise interest rates
EURUSD
EURUSD Daily Chart. Source: Tradingview
EURUSD traded lower during the early Asian session and is now testing the 1.0500 key level again. Sentiment remains bearish with 1.0650 acting as the first resistance and a short-term target at 1.0350.
XAUUSD

XAUUSD H4 Chart. Source: Tradingview
NFP came out slightly better than forecast with a print of 428k versus 390k and there weren’t much directional movements in gold following the release. Its outlook remains bearish where the trendline is still intact and the price is trading below both moving averages. 1850 will be the next key level that we are looking at should gold continues to trade lower as we wait for European’s trading volume to kick in. In the meantime, higher interest rates is keeping gold prices in check.
Crude Oil
Crude Oil Daily. Source: Tradingview
Crude oil slips as investors are concerned about weakening oil demand due to a global recession fear. Lockdowns in China certainly did not help while Aramco cut its oil prices from record highs for Asia. From a technical perspective, a bullish trendline together with $105 and 50 daily moving average will be the first line of support for oil prices. We are eyeing for the upcoming embargo on Russian oil by the EU which could push prices up.
US Stocks markets

SP500 Daily. Source: Tradingview
USTEC Daily. Source: Tradingview
SP500 closed down 0.57% while Nasdaq fell 1.84% to end the previous trading week, following market reactions to a raise in US interest rates and better than expected job numbers.
Considering the strong bearish momentum of the stocks markets (SP500 closed the past 5 consecutive weeks in loss), SP500 is most likely testing 4000 key level this week while Nasdaq may see some reaction at the 12300 level.
Cryptocurrencies
BTCUSD Daily. Source: Tradingview
Finally, there are some solid moves in Bitcoin, although it is not good news for the bulls. It dropped more than 15% in the past 5 days and is currently trading sub $35k. The next big level to watch out for is $30k and we expect some higher than usual volatility there as it is a major area.
BreadMaker
Trader, Technical Analyst
Sign up at FXPIG now and trade with raw spreads starting from 0 pip and commissions as low as $2 per lot per side!
As Expected
The short-term interest rates have been raised 50 basis points to a target rate of 0.75%-1% during the FOMC Meeting yesterday, which is what the market was expecting. Although the news has mostly been priced in, it was still the most aggressive rate hike since 2000 as inflation levels soared through the roof and hit decades-high levels.
Global Developments
Covid-related lockdowns in China and the war between Ukraine and Russia certainly did not help. In fact, they were adding a burden to the global supply chains, which put more upward pressure on inflation, not just in the US, but we have also noticed inflation levels rising steadily in the UK and Australia for example. Australia also raised its cash rate by 25 basis points just a few days ago, the first time in more than 10 years.
Projections
In the effort to contain inflation and reverse the loose monetary policies employed during the pandemic period, the central bank stated that it will continue to raise rates throughout the year.
Not only that, but the U.S. balance sheet will also be trimmed steadily starting from next month, with $47.5 billion monthly for the period between June and September, then the rate will be sped up with $95 billion of assets being let go per month.
Impact
As interest rates continue to rise, what is the impact on the economy as a whole?
Some of the most direct impacts are going to be on businesses and consumers. Consumers now have to pay higher interest rates for mortgages, credit cards spendings, etc and there will be lesser disposable income for the consumers to spend and people start to manage their finances more carefully. Meanwhile, businesses incur a higher cost for borrowing, which would subsequently reduce business activities and investments, while also taking hits from reduced demand from consumers.
I mean, isn’t this what a hawkish Fed’s contractionary monetary policy is all about?
Trading
Since FOMC has been one of the most important, if not the most important economic news release as of late, let’s have a look at the impact of the event on EURUSD, the most heavily traded Forex pair.
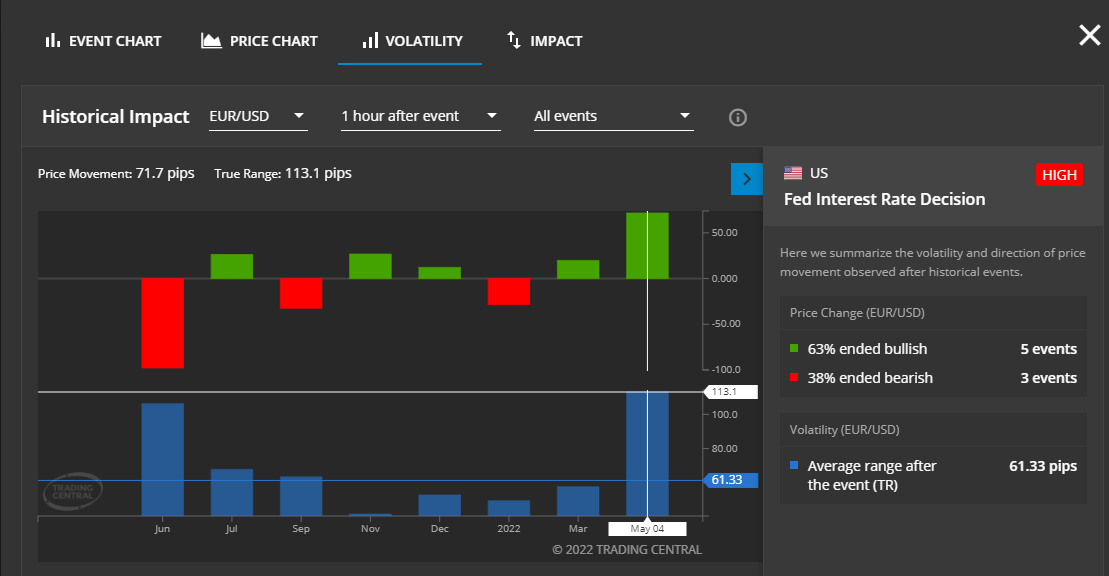
Source: Trading Central Economic Insight
As you can see, the event yesterday has caused the EURUSD to have the greatest True Range in the past eight events, at 113.1 pips one hour after the event took place.
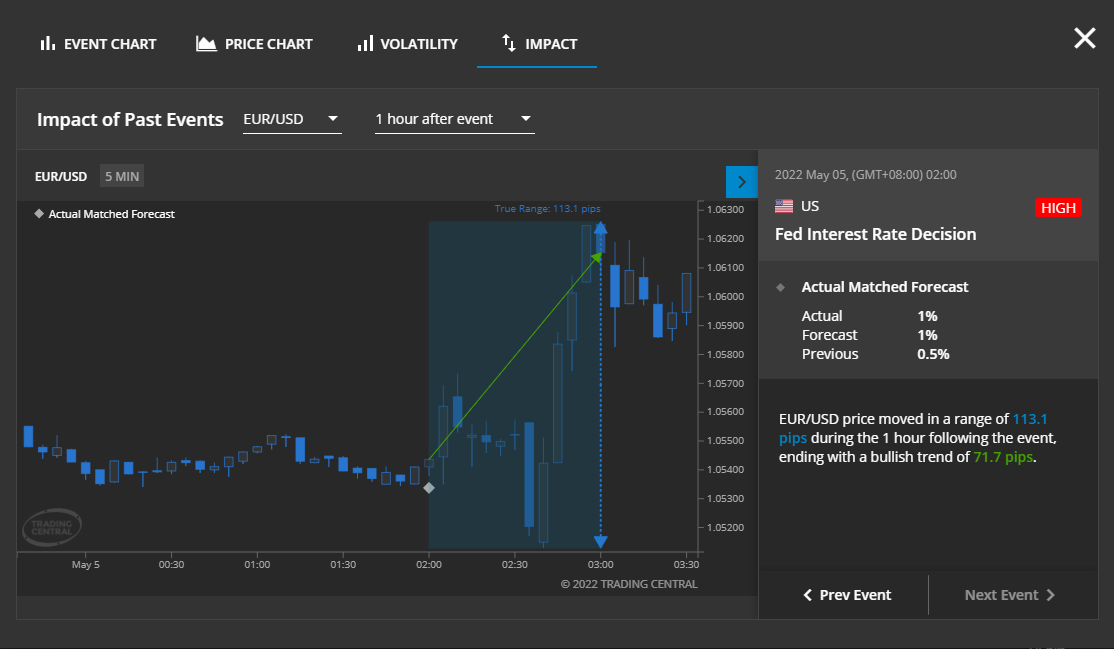
Source: Trading Central Economic Insight
EURUSD moved up 71.7 pips in an hour post-FOMC meeting, which means the dollar lost some strength relative to Euro. The details of every individual event will also be shown in the section to the right side of the chart and you can also click on “< Prev Event” to view historical events to make your backtesting life easier. Charts and data all in one place, what more can you ask for?
The next FOMC event is scheduled to be on the 14th and 15th of June and so you have plenty of time to utilize Economic Insight to carry out your market research and capitalize on the next FOMC meeting.
–
Want access to Economic Insight and many more tools from Trading Central?
Sign up now at FXPIG to get access for free!


